Figures & data
Figure 1. Study flow figure
Table 1. Demographic and clinical characteristics of participants
Table 2. Physical and emotional symptoms. Subthemes are sorted by number of mentions (decreasing) within each theme
Table 3. Impact on daily life and socio-contextual factors. Subthemes are sorted by number of mentions (decreasing) within each theme
Table 4. Response to illness. Subthemes are sorted by number of mentions (decreasing) within each theme
Table 5. Perceived needs in treatment. Subthemes are sorted by number of mentions (decreasing)
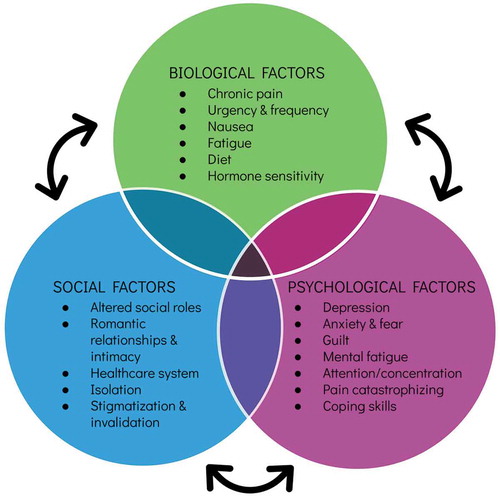
Figure 2. Biopsychosocial model of IC/BPS