Figures & data
Figure 1. The PRISMA flowchart.
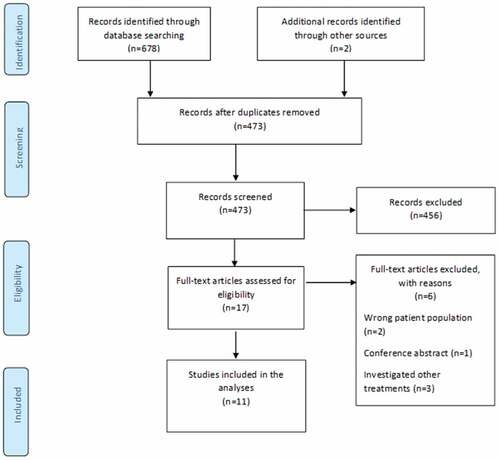
Table 1. Characteristics of patients in included studies.
Figure 2. Authors’ judgments about each risk of bias item across all included studies.
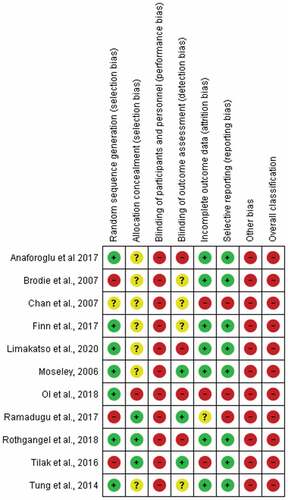
Figure 3. Authors’ judgments about each risk of bias item presented as percentages across all included studies.
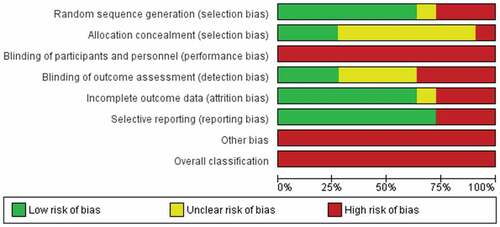
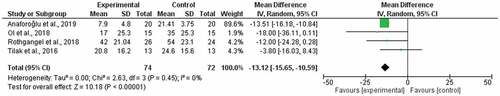
Figure 4. Forest plot for the effects of GMI versus routine care on pain severity at 6 weeks.
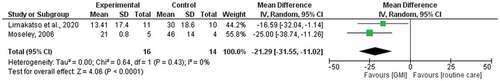
Figure 5. Forest plot for the effects of GMI versus routine care on pain severity at 6 months.
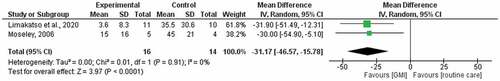
Table 2. The certainty of the evidence.
Figure 6. Forest plot for the effects of mirror therapy versus covered mirror therapy on pain severity.
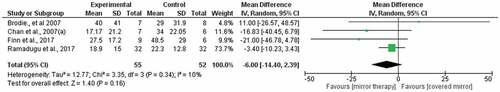
Figure 7. Forest plot for the effects of mirror therapy versus control treatments on pain severity.