
Figures & data
Table 1. Characteristics of included studies arranged by similarity in outcomes and analysis undertaken.
Figure 1. PRISMA flow chart of studies included and excluded throughout each phase of the systematic review.
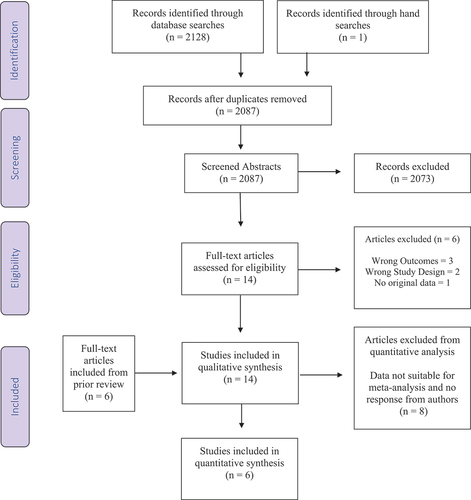
Table 2. Risk of bias of included studies.
Figure 2. Change in self-reported pain ratings after oxytocin or placebo administration. Positive values represent a change favouring oxytocin.
Figure 3. Correlation between self-reported ratings of pain intensity and basal oxytocin concentration.
Figure 4. Correlation between self-reported ratings of depressed mood and basal oxytocin concentration.
Table 3. Narrative synthesis.
Table 4. Mean endogenous oxytocin concentrations in chronic pain patients versus healthy controls.
Supplemental material