
Figures & data
Figure 1. Decision tree.
Improvement = pain reduction (reduce NRS), increasing functional scale (increase PPS), and quality of life (increase EQ-5D score).
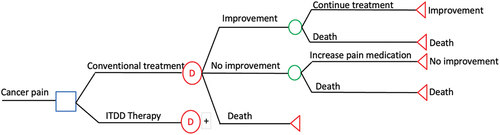
Figure 2. Patient flowchart.
Table 1. Demographic data (n = 20).
Table 2. Clinical outcomes.
Figure 3. Graph depicting median opioid consumption among patients receiving ITDD therapy.
Opioid consumption includes all routes of administration. The blue line represents the total opioid consumption of the ITDD therapy group; the median rate of increase was 1.88% per month.
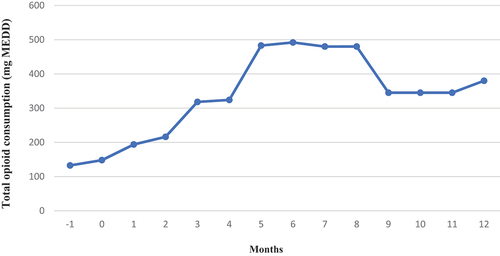
Table 3. Lifetime costs of treatment: Conventional therapy vs. ITDD therapy (n = 15) after 2 months.
Figure 4. The accumulation of total costs.
The orange and blue lines represent the accumulated total costs per patient of the IT programmable pump and IT percutaneous port therapy groups, respectively. The IT therapy depiction was stopped at 8 months because all patients died. The yellow line represents the projected accumulated total costs for a conventional therapy group assuming patients had remained on their pre-ITDD analgesic regimen with projected increases by 1.88% per month, which was the actual dose increase in the ITDD group.
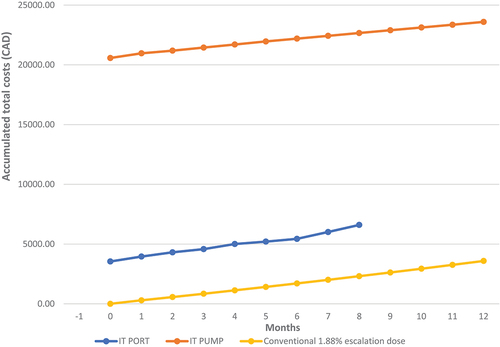
Table 4. Cost-effectiveness and cost–utility analyses at 2 months after ITDD therapy.