
Figures & data
Figure 1. Radar plot generated for the patient using the clinical reasoning framework described by Walton and Elliott.Citation6
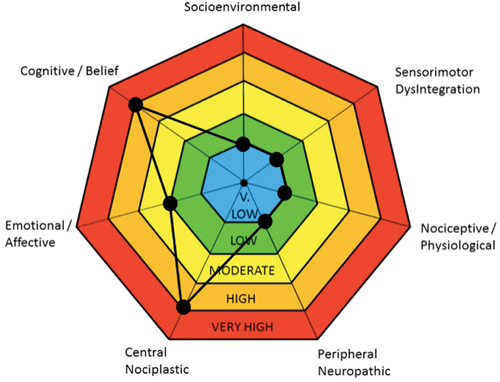
Table 1. Baseline PROM scores with interpretation.
Table 2. Postintervention PROM scores with interpretation.