Figures & data
Figure 1. Number of hospitalizations for ischemic heart disease and COPD in the United States between 1985 and 2010 (left vertical axis) and the percentage of the population who smoked cigarettes (right vertical axis) over the same time period. There has been a progressive reduction in admissions for heart disease that is not mirrored for COPD despite a continuous reduction in the prevalence of smoking. Adapted from Reference 2 and reprinted with permission of the American Thoracic Society. Copyright (c) 2017 American Thoracic Society. Khakban A, Sin DD, FitzGerald JM, McManus BM, Ng R, Hollander Z, Sadatsafavi M. The Projected Epidemic of Chronic Obstructive Pulmonary Disease Hospitalizations over the Next 15 Years. A Population-based Perspective. Am J Respir Crit Care Med. 2017 Feb 1;195(3):287–291. The American Journal of Respiratory and Critical Care Medicine is an official journal of the American Thoracic Society.
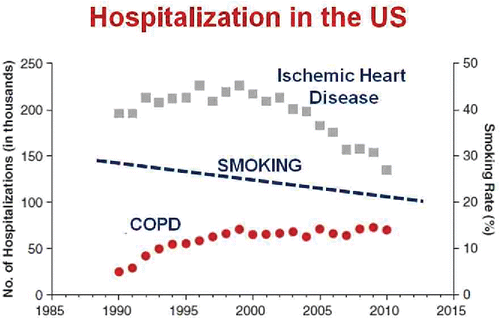
Figure 2. Actual (solid line) and projected (dotted line) in-patient hospitalization days for exacerbations of COPD in the Province of British Columbia between 2000 and 2030 stratified by age group. Adapted from Reference 2 and reprinted with permission of the American Thoracic Society. Copyright (c) 2017 American Thoracic Society. Khakban A, Sin DD, FitzGerald JM, McManus BM, Ng R, Hollander Z, Sadatsafavi M. The Projected Epidemic of Chronic Obstructive Pulmonary Disease Hospitalizations over the Next 15 Years. A Population-based Perspective. Am J Respir Crit Care Med. 2017 Feb 1;195(3):287–291. The American Journal of Respiratory and Critical Care Medicine is an official journal of the American Thoracic Society.
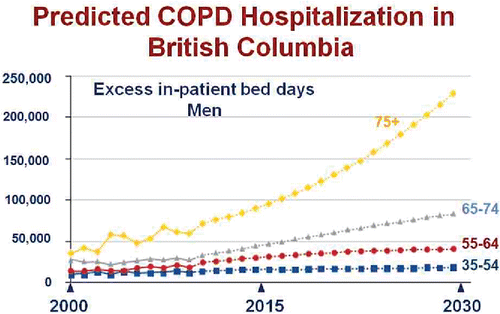
Figure 3. Genome Wide Association Studies (GWAS) require a large number of cases matched for demographics with a large number of controls. Each individual is genotyped at one million or more polymorphic sites in their genome and the distribution of genotypes at each locus is compared in cases and controls. Finding a genotype whose frequency is different between cases and controls with a p value < 5 × 10⁻⁸ indicates a susceptibility locus for the disease (ie, a genetic variant that increases risk).
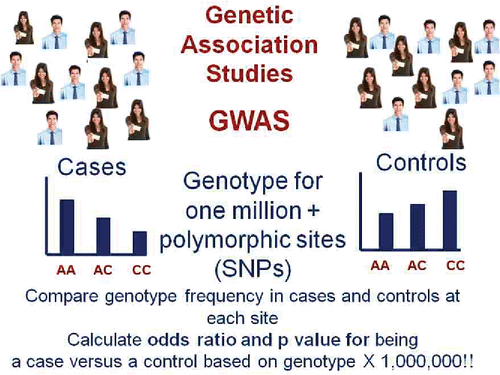
Figure 4. The results of GWAS are depicted as a Manhattan plot, which is named as such because they resemble the Manhattan skyline. Each polymorphic DNA site (mainly single nucleotide polymorphisms [SNPs]) is shown with a colored dot ordered by location on the chromosomes versus the negative log 10 p value that is associated with the trait or disease of interest. The red dotted line is at 5 × 10⁻⁸ and is the conventional threshold for significance given the large number of tests that are performed.
![Figure 4. The results of GWAS are depicted as a Manhattan plot, which is named as such because they resemble the Manhattan skyline. Each polymorphic DNA site (mainly single nucleotide polymorphisms [SNPs]) is shown with a colored dot ordered by location on the chromosomes versus the negative log 10 p value that is associated with the trait or disease of interest. The red dotted line is at 5 × 10⁻⁸ and is the conventional threshold for significance given the large number of tests that are performed.](/cms/asset/afe67f47-5f9e-409f-b3b9-302402268913/ucts_a_1361203_f0004_c.gif)
Figure 5. A schema for epithelial-centric origin of asthma. Environmental factors including viruses, pollution and allergens cause release of TSLP and IL33 from airway epithelium. TSLP and IL33 (via ST-2) stimulate the release of Th2 cytokines (including IL13) that have a direct effect on structural airway cells and stimulate the release of inflammatory cells from the bone marrow. The genes for which genetic variants alter susceptibility for asthma are indicated in red text.
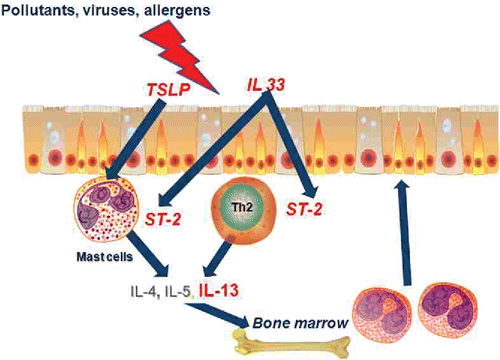
Figure 6. A Manhattan plot for a large GWAS of lung function. A total of 26 loci achieved genome-wide significance for association with FEV1% predicted and/or FEV1/FVC%. Data for FEV1/FVC% are shown. Most genes were not a priori candidates for low lung function. Two genes, HHIP and PTCH1 are indicated with arrows and are in the hedgehog signaling pathway. See text for more discussion of these genes. Reprinted by permission from Macmillan Publishers Ltd: Soler Artigas M, Loth DW, Wain LV, et al. Genome-wide association and large-scale follow up identifies 16 new loci influencing lung function. Nat Genet. 2011 Sep 25;43(11):1082–1090.
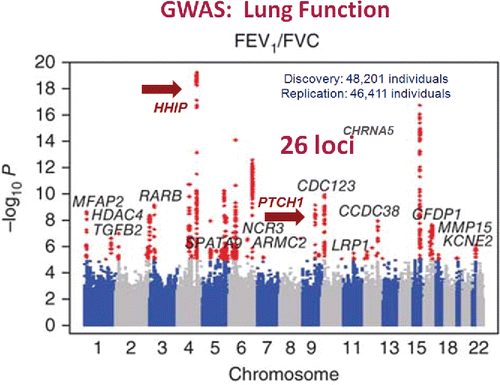
Figure 7. A Manhattan plot for a large GWAS of COPD. A total of 22 loci achieved genome wide significance for association with COPD in this case control design. HHIP, which was also identified as a susceptibility locus for low lung function, is indicated by the red arrow and was the most significant “hit.” Reprinted by permission from Macmillan Publishers Ltd: Hobbs BD, de Jong K, Lamontagne M, et al. Genetic loci associated with chronic obstructive pulmonary disease overlap with loci for lung function and pulmonary fibrosis. Nat Genet. 2017 Mar;49(3):426–432.
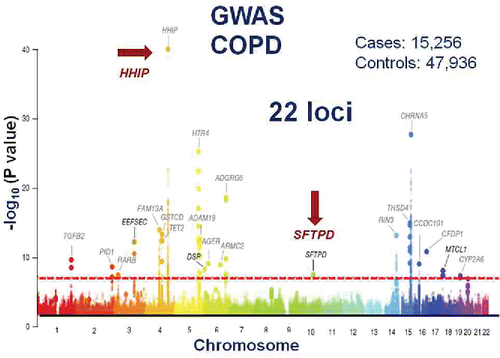
Figure 8. Genetic variation can affect phenotype by altering the amino acid sequence and, thus, the structure or function of the coded protein, or can affect sequences that influence the quantity of mRNA and thus protein produced. The latter are termed expression quantitative trait loci or eQTLs.
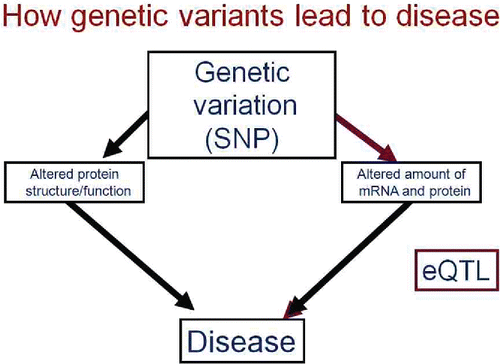
Figure 9. Typical Manhattan plot for a cis, or local, eQTL. SNPs on chromosome 14 are highly significantly associated with the level of gene expression of a nearby gene.
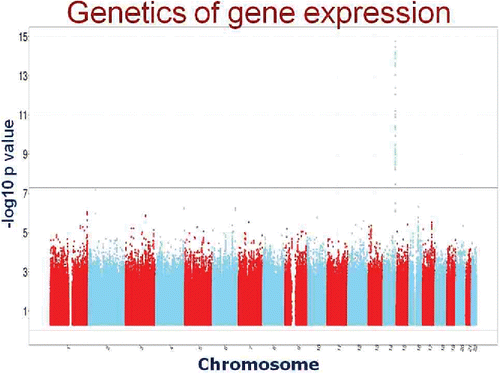
Figure 10. A. Unraveling the causal pathway by which gene variation influences phenotype. If a SNP is a risk factor for a trait AND the same SNP alters the level of expression of a gene, this suggests that the increased risk is caused by altered gene expression. This premise is strengthened if the level of gene expression is related, in the predicted direction, to the phenotype in affected individuals. B. Causal pathway analysis for HHIP. SNPs that increase risk for low lung function and COPD increase lung tissue mRNA for HHIP AND increased lung tissue HHIP mRNA are associated with lower lung function and COPD. C. Causal pathway analysis for PCTH1. SNPs that increase risk for low lung function are associated with lower lung tissue mRNA for PTCH1 AND lower lung tissue PTCH1 mRNA is associated with lower lung function.
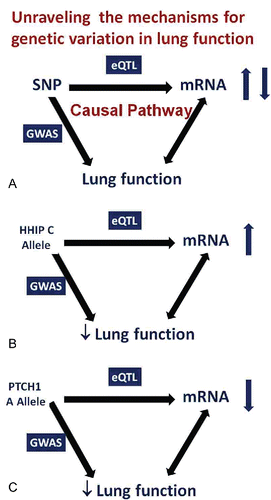
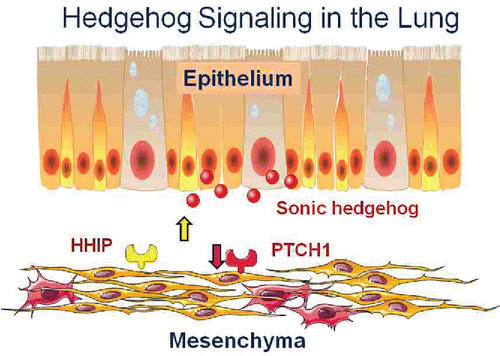
Figure 11. Hedgehog signaling in the lung. The ligand Sonic Hedgehog is secreted by lung epithelial cells and acts on lung fibroblasts via its receptor PTCH1. HHIP negatively regulates the pathway by inhibiting the ligand. Increased HHIP and decreased PTCH1 are found in COPD lung tissue suggesting that decreased hedgehog signaling is a risk factor for COPD and, conversely, that stimulation of the pathway could be beneficial (See Reference Citation19).