
Figures & data
Figure 1. Algorithm for interpretation of T-SPOT®.TB assays.
T-SPOT product insert can be consulted for additional information and details: https://www.tspot.com/wp-content/uploads/2021/04/TB-PI-US-0001-V9.pdf.
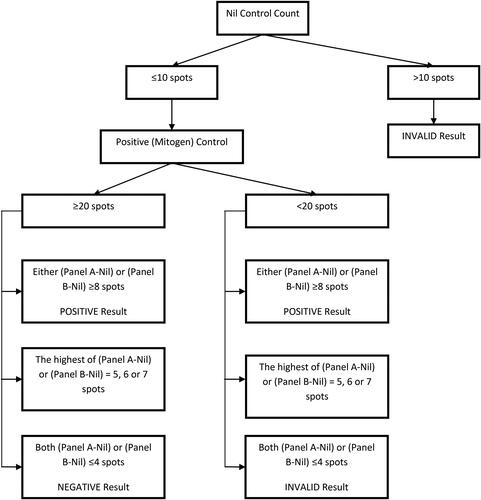
Table 1. Number of bacteria seen on microscopy and laboratory interpretation.a
Table 2. Summary of suggested turnaround times (refer to individual section for more information).Citation 28
Table 3. QuantiFERON®-TB Gold Plus interpretive criteria (manufacturer’s recommendations).