
Figures & data
Figure 1. Phylogenetic tree scale.
Unrooted tree scale that measures genetic distance between 50 genomes comprised of 22 pairs and two triplets. Genomes are listed by CaseNo., episode and lineage. The horizontal axis shows the scale representing the number of single nucleotide polymorphism (SNP)s divided by the sequence length; 0.100 is equivalent to 10%. CaseNo. 1, 9, 11, 14, 20, 24 (all episode 2) and 11 (episode 3) had SNPs >160 whose final tree scale positions were different from Episode 1 and 2. They were all lineage 4. The horizontal final position can also be obtained from Online Supplementary Table S1.
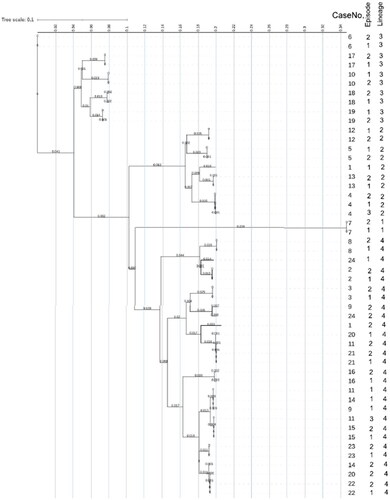
Figure 2. Distribution of reported tuberculosis (TB) cases 1989–2018.
Shows the distribution for all reported TB cases 1989 to 2018 by step to the number of sequenced cases. A total of 67 culture positive recurrent pairs were not sequenced because they could not be found or could not be reconstituted, 26 pairs were sequenced and 67 pairs were not sequenced.
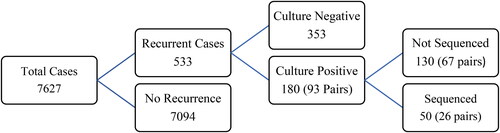
Table 1. Paired SNP matrix for 26 recurrent TB cases.
Table 2. Paired phylogenetic TIP difference matrix for 26 recurrent TB cases.
Table 3. Determining relapse and reinfection combining SNPs and TIPs.
Table 4. Reinfection risk score.
Table 5. Epidemiological and clinical comparison of relapse and reinfection cases.