Figures & data
Table 1. Descriptive statistics and correlations between Big Five and Dark triad traits, all candidates.
Figure 1. Personality profile of all candidates. Note: all variables vary between 0 ‘very low’ and 4 ‘very high’. N = 157. E ‘Extraversion’; A ‘Agreeableness’; C ‘Conscientiousness’; Es ‘Emotional stability’; O ‘Openness’; N ‘Narcissism’; P ‘Psychopathy’; M ‘Machiavellianism’. + Indicates extreme values (more than 1.5 * interquartile range away from the median).
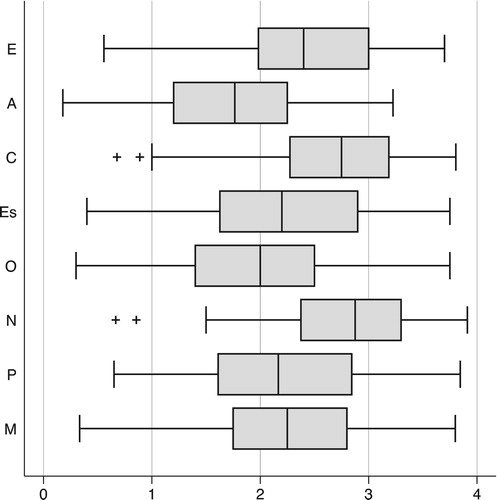
Figure 2. Personality profile of autocrats. Note: all variables vary between 0 ‘very low’ and 4 ‘very high’. The light-grey dotted area represents the average score of autocrats on all personality traits. The darker bold outline represents the profile of the candidate. E ‘Extraversion’; A ‘Agreeableness’; C ‘Conscientiousness’; Es ‘Emotional stability’; O ‘Openness’; N ‘Narcissism’; P ‘Psychopathy’; M ‘Machiavellianism’.
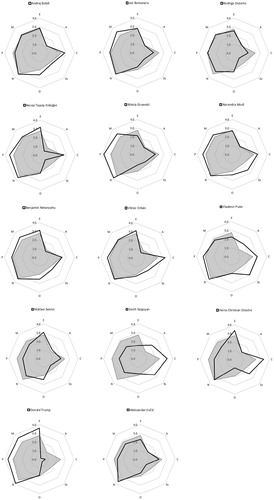
Figure 3. Personality profile of autocrats and non-autocrats. E ‘Extraversion’; A ‘Agreeableness’; C ‘Conscientiousness’; Es ‘Emotional stability’; O ‘Openness’; N ‘Narcissism’; P ‘Psychopathy’; M ‘Machiavellianism’. All variables vary between 0 ‘very low’ and 4 ‘very high’. N(Autocrats) = 14. N(Non-Autocrats) = 143. N(Left) = 59. N(Centre) = 25. N(Right) = 59.
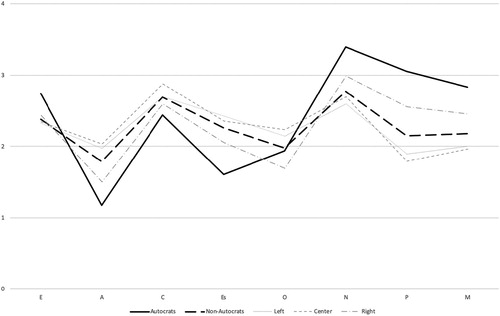
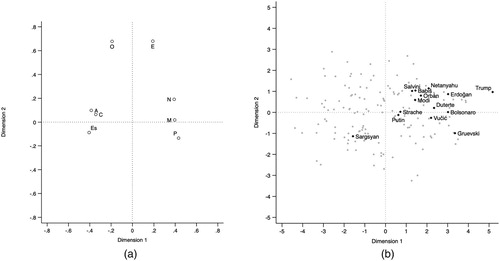
Figure 4. Second-order factors. a. Loadings plot: personality components scores on underlying dimensions. b. Scatterplot: candidates scores on underlying dimensions. Note: The figure reports scores form a Principal Component Analysis (PCA). E ‘Extraversion’; A ‘Agreeableness’; C ‘Conscientiousness’; Es ‘Emotional stability’; O ‘Openness’; N ‘Narcissism’; P ‘Psychopathy’; M ‘Machiavellianism’. All variables vary between 0 ‘very low’ and 4 ‘very high’.