Figures & data
Figure 1. Frequency plot of 50 most frequent terms appearing in title or abstract in the final sample of research articles.
Note: The plot shows the number of occurrence of the 50 most frequent terms appearing in the abstract or title in the final samples after common pre-cleaning steps (removal of punctuation, numbers and stop words; transformation to lower cases; stemming). N = 4306 papers.
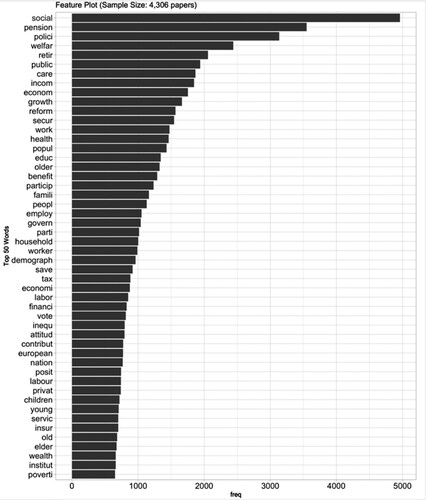
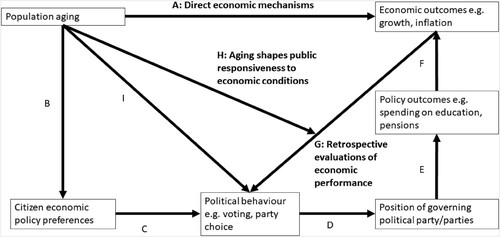
Figure 2. Pathways between population ageing and economic outcomes.