
Figures & data
Figure 1. Probability to vote (PTV) for VOX and Chega in 2019 (authors own online survey, wave 2).
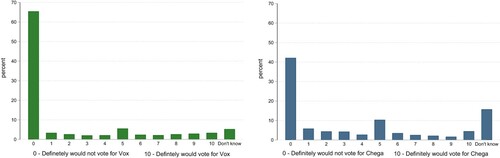
Figure 2. Sociodemographic factors (H1).
Linear regression coefficients (PTV) and odds ratios from logistic regression (vote recall). Full models in and in the Appendix. Data: authors own online survey, wave 2.
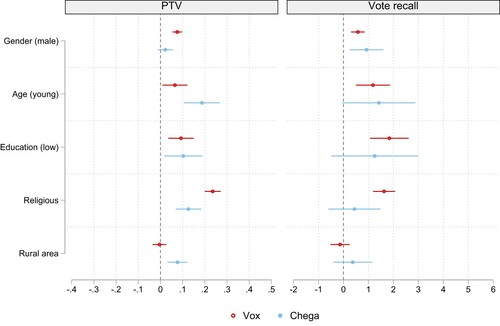
Figure 3. Political dissatisfaction (H2).
Linear regression coefficients (PTV) and odds ratios from logistic regression (vote recall). All models additionally control for gender, age, education, religion and rural vs. urban. Full models in and in the Appendix. Data: authors own online survey, wave 2.
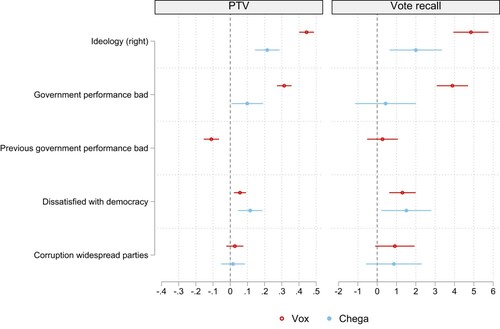
Figure 4. Globalization losers (H3).
Linear regression coefficients (PTV) and odds ratios from logistic regression (vote recall). All models additionally control for gender, age, education, religion and rural vs. urban. Full models in and in the Appendix. Data: authors own online survey, wave 2.
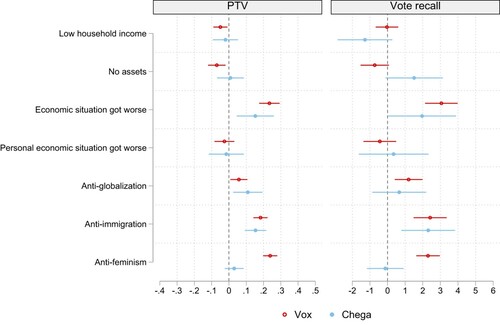
Figure 5. Media diet (H4).
Linear regression coefficients (PTV) and odds ratios from logistic regression (vote recall). All models additionally control for gender, age, education, religion and rural vs. urban. Full models in and in the Appendix. Data: authors own online survey, wave 2.
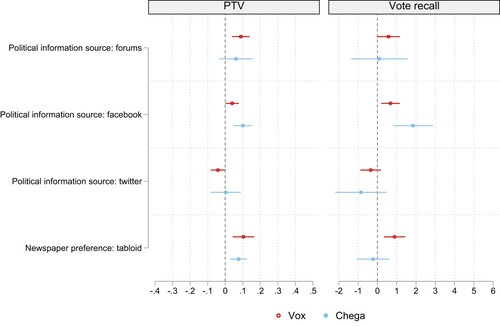
Figure 6. Country-specific issues (H5).
Linear regression coefficients (PTV) and odds ratios from logistic regression (vote recall). All models additionally control for gender, age, education, religion and rural vs. urban. Full models in and in the Appendix. Data: authors own online survey, wave 2.
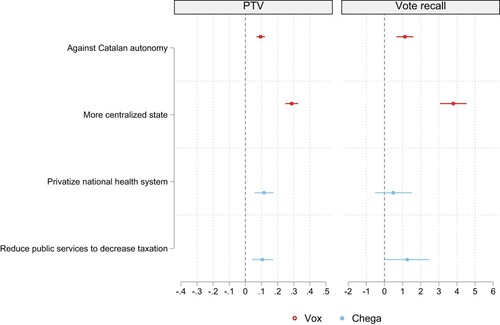
Table A1. Explaining the probability to vote for VOX and Chega (full models to figures 2–6, left panel).
Table A2. Explaining the vote choice for VOX and Chega (full models to figures 2–6, right panel).