
Figures & data
Table 1. Summary of survey projects, for which responses to questions about party preferences were mapped in PPC.
Figure 1. Survey support and election results for Bulgaria's National Movement Simeon the Second, 2001–2013. Points indicate survey proportions of respondents who declared having voted, the intention to vote, or support for the party, weighted with survey weights, with 95% confidence intervals for the proportions. Grey lines indicate election dates, while grey diamonds indicate vote shares received. Survey data come from: Candidate Countries Eurobarometer, Eurobarometer, European Social Survey, European Values Study, Integrated and United, New Europe Barometer, World Values Survey. Information on vote shares in elections and election dates comes from ParlGov's Elections dataset.
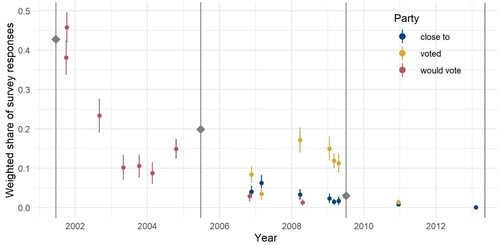
Figure 2. Survey support and election results for Poland’s Democratic Left Alliance and its coalitions, 1991–2019. Points indicate survey proportions of respondents who declared having voted, the intention to vote, or support for the Democratic Left Alliance or coalitions it formed, weighted with survey weights, with 95% confidence intervals for the proportions. Colours indicate the name of the party/alliance asked about in the survey question. The shape indicates the type of the survey question. Grey lines indicate election dates, and grey diamonds indicate vote shares received. Survey data come from: Candidate Countries Eurobarometer, Consolidation of Democracy in Central and Eastern Europe, Eurobarometer, European Social Survey, European Values Study, Integrated and United, International Social Survey Programme, New Europe Barometer, World Values Survey. Information on vote shares in elections and election dates comes from ParlGov's Elections dataset.
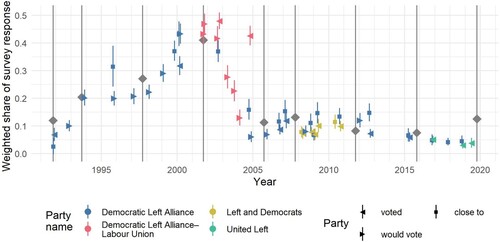
Figure 3. Correlations between respondent’s left-right self-placement and the characteristics of preferred parties in Poland and Slovenia over time. Survey data include: Candidate Countries Eurobarometer, Consolidation and Democracy in Central and Eastern Europe, Eurobarometer, European Social Survey, European Values Study, World Values Survey. Information on party characteristics comes from V-Dem’s V-Party dataset. Dashed horizontal lines indicate correlations of −0.5, 0, and +0.5.
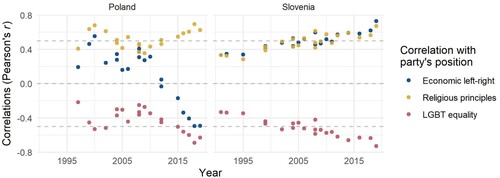
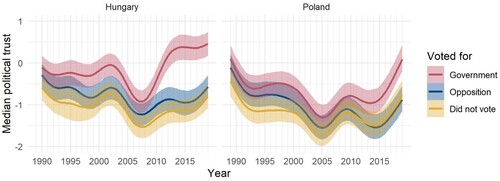
Figure 4. Estimated median levels and 95% posterior credible intervals of political trust based on survey responses to items on trust in the national parliament, political parties, and justice system, among supporters of electoral winners, losers, and non-voters in Hungary and Poland over time. Survey data include: Candidate Countries Eurobarometer, Consolidation and Democracy in Central and Eastern Europe, Eurobarometer, European Social Survey, European Values Study, International Social Survey Programme, New Europe Barometer, World Values Survey. Information on party status comes from V-Dem’s V-Party dataset.
Data availability statement
PPC is available at https://osf.io/w7q4u.