Figures & data
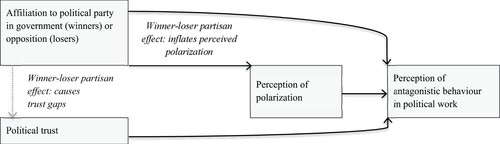
Figure 1. Postulated relationships between partisanship, trust, perceptions of polarization and antagonistic behaviour in political work.
Note: The winner-loser partisan effect on trust (in grey) is controlled for in the analysis, but is not the main focus for this study.
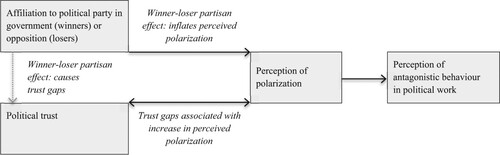
Table 1. Perceived political polarization and antagonistic behaviour. Multilevel regression analysis – varying intercept only model.
Table 2. The variables of the analyses, descriptive information (mean, standard deviation and number of cases) and correlation (Pearson’s r) with dependent variables.
Table 3. Correlation analysis (Pearson’s r) among independent variables.
Table 4. Factors explaining local councillors’ perception of polarization and antagonistic behaviour in their own municipality (multilevel regression analysis. two levels. estimates of fixed effects, SE in parenthesis).
Figure 2. Results on the relationship between partisanship, trust, perceived polarization and antagonistic behaviour.
Note: The winner-loser partisan effect on trust (in grey) is controlled for, and confirmed, in a control analysis not presented in this paper.