Figures & data
Figure 1. The structure of the experiment.
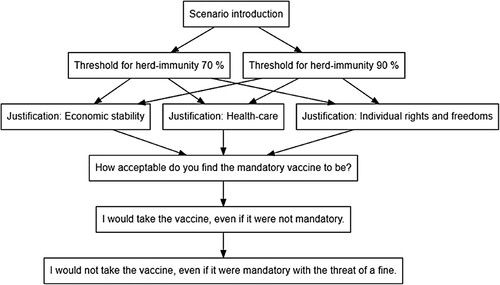
Table 1. Descriptive statistics.
Figure 2. The means of the dependent variables across experimental treatments. Note: The error bars show the boundaries of the 95% confidence interval. The labels refer to justifications, followed by thresholds for herd immunity in parentheses.
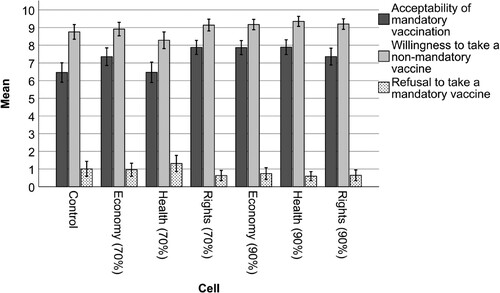
Table 2. Two-way ANOVA results. Dependent variable: Acceptability of mandatory vaccination.
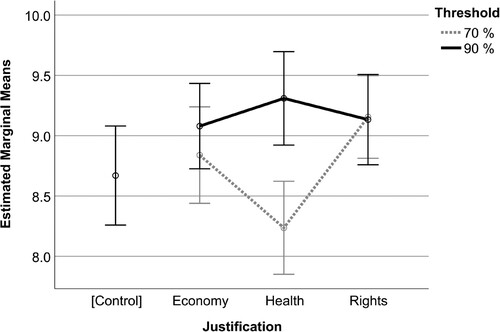
Figure 3. The estimated marginal means of the acceptability of mandatory vaccination. Note: The error bars show the boundaries of the 95% confidence interval.
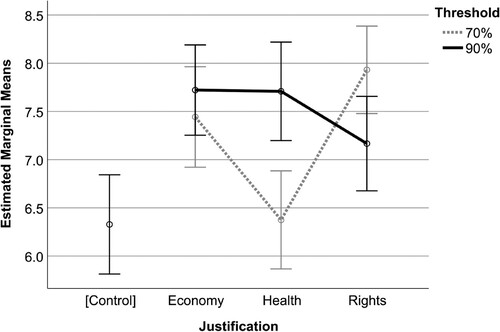
Table 3. Two-way ANOVA results. Dependent variables: Willingness to take a non-mandatory vaccine and Refusal to take a mandatory vaccine.
Figure 4. The estimated marginal means of the willingness to take a non-mandatory vaccine. Note: The error bars show the boundaries of the 95% confidence interval.