
Figures & data
Figure 1. Organization of the electoral process in Italy – example for the municipality of Rrome.
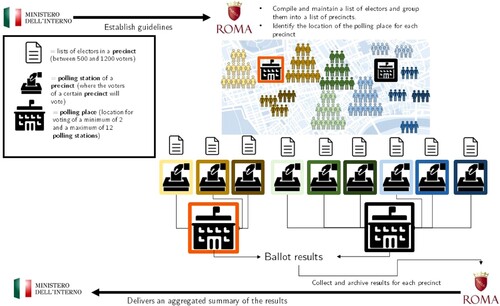
Figure 2. The Electoral Roadmap Dataset.
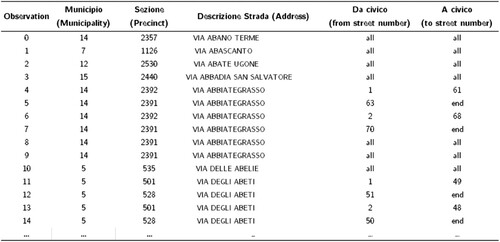
Figure 3. Voronoi procedure.
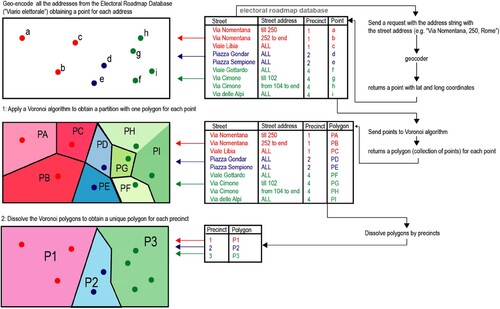
Figure 4. Census procedure.
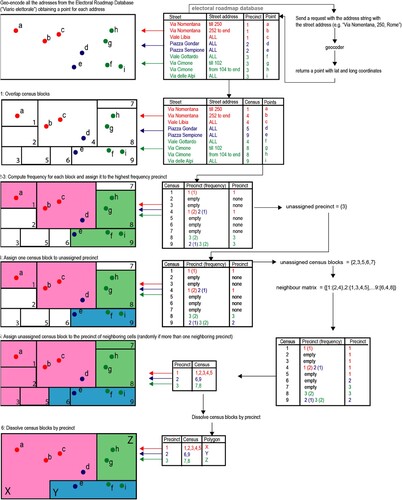
Figure 5. A comparison between the two procedures (Voronoi vs Census) in a neighbourhood of Rome.
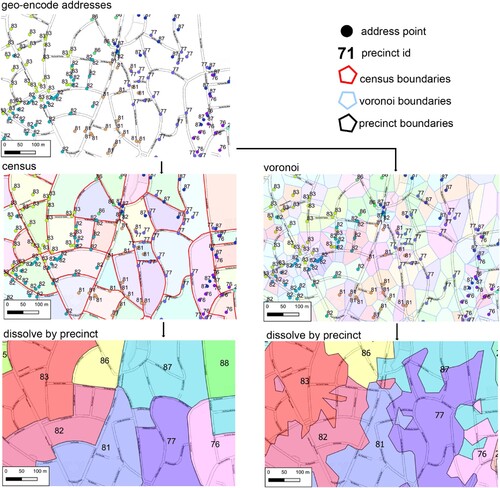
Figure 6. Validation metrics.
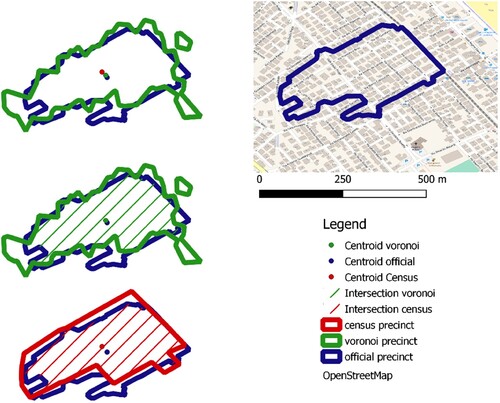
Table 1. Results for validation metrics.
Figure 7. Screenshot of the web app.
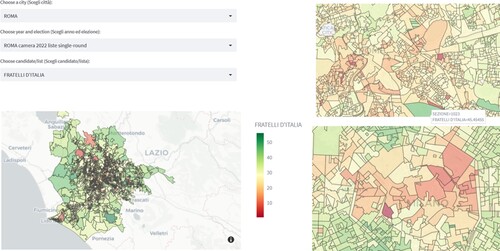
Figure 8. Inequality in voting behaviour – Gini Index.
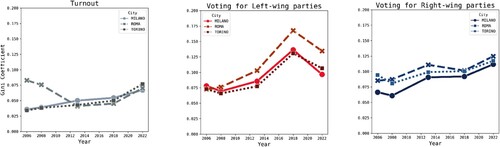
Figure 9. Spatial polarization in voting behaviour – Moran I Index.
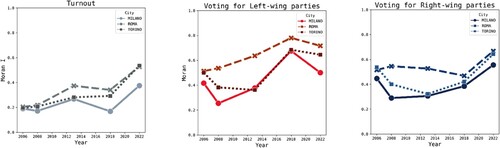
Figure 10. Spatial inequality in voting behaviour – Polarization index (80/20 percentiles ratio).
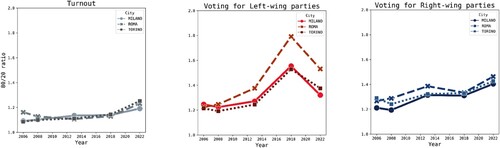
Figure 11. First party/coalition in national election at precinct level.
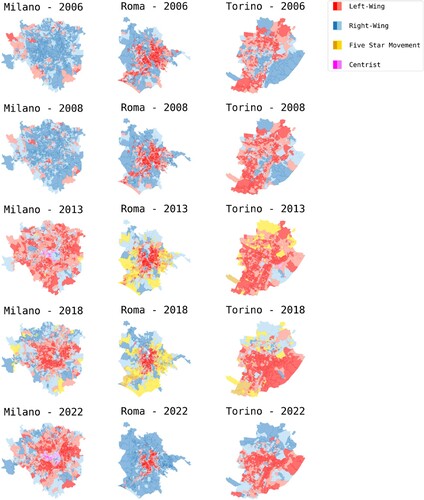
Figure 12. Support for left-wing parties in Limited Traffic Zones (national elections).
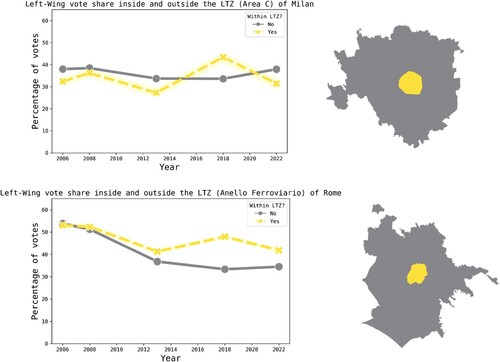
Figure A1. Coverage of the dataset.
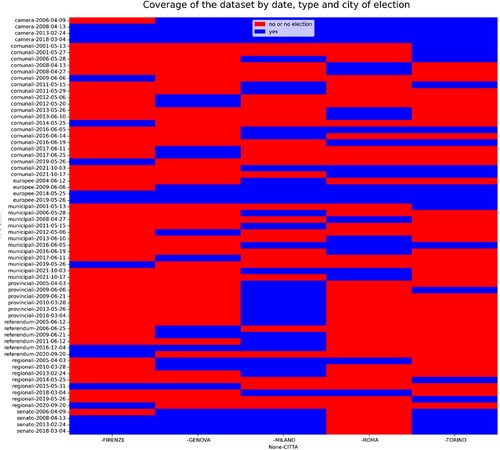
Table A1. Classification of parties
Figure A2. Delete points outside city borders.
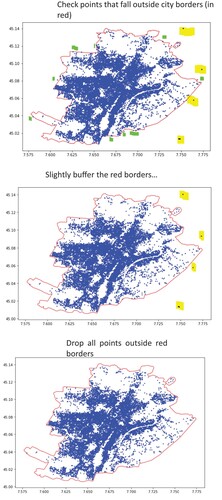
Figure A3. Geocoder errors in Palermo and Turin.
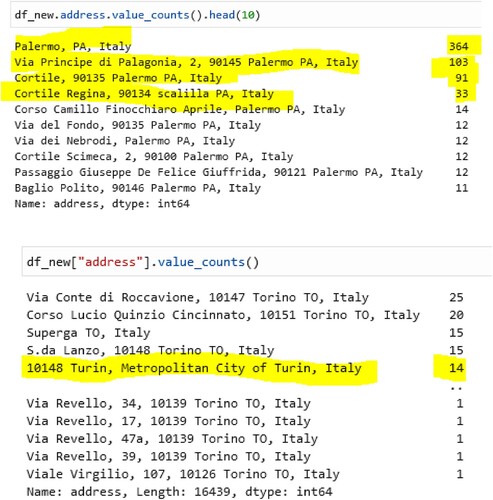
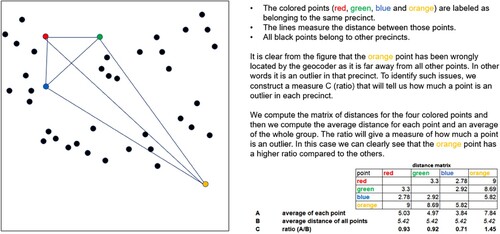
Figure A4. Label wrongly geocoded points.
Data availability statment
The data that support the findings of this study are openly available in a github repository that can be accessed at this link https://github.com/gabrielepinto/dati-sezioni-elettorali