
Figures & data
Figure 1. Alignment via Procrustes rotation.
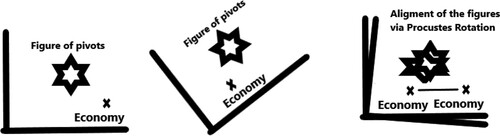
Figure 2. Evolution of salience of several key frames in El País and El Mundo.
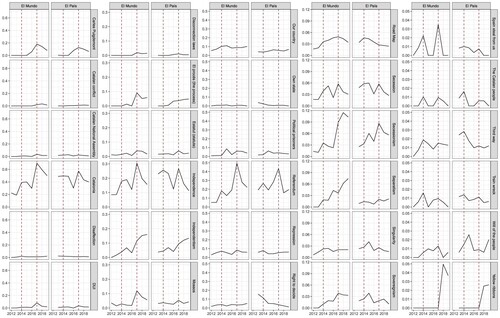
Figure 3. Average salience of the set of 216 frames associated to the Catalan political conflict and number of those that reach a minimum significant level.
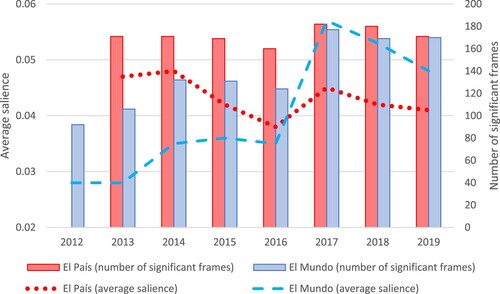
Figure 4. Evolution of meaning focalization index for selected frames (2012–2019).
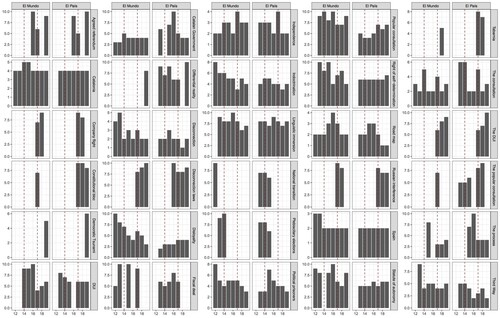
Figure 5. Average focalization of key frames associated to the Catalan political conflict.
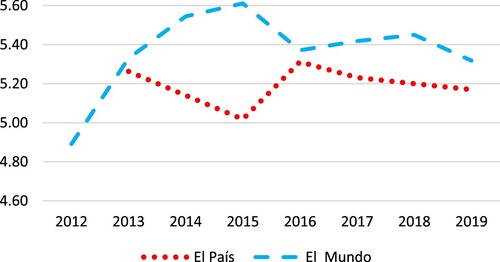
Table 1. Average focalization of frames (out of the 216 frames in the analysis)(N = number of frames reaching the minimum frequency threshold)
Figure 6. Continuity in meaning of core words/frames in semantic spaces (El País and El Mundo)
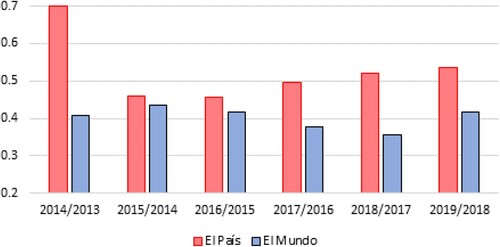
Figure 7. Continuity in meaning in consecutive years for a set of frames associated to the Catalan political conflict.
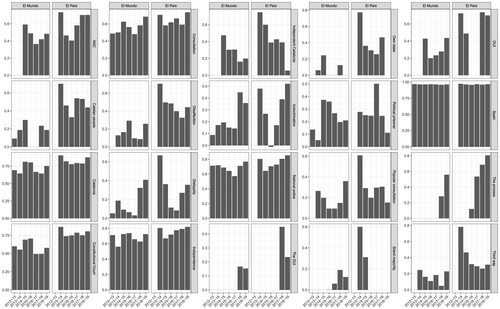
Table 2. Degree of resonance of the meaning of selected frames on the meaning of the same frame in 2019.
Table 3. Number of meaning dimensions (factor analysis) (2012–2019).
Figure 8. Frames cloud representing semantic association of ‘political prisoners’.Footnote13
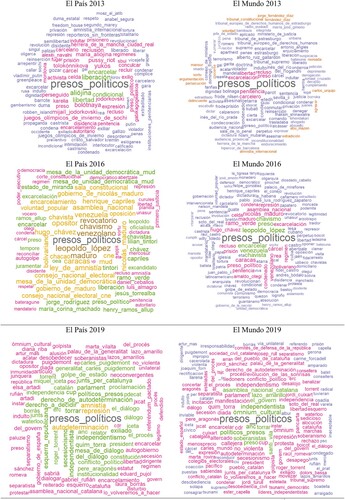
Figure 9. Frames cloud representing semantic association of the term ‘catalanism’.
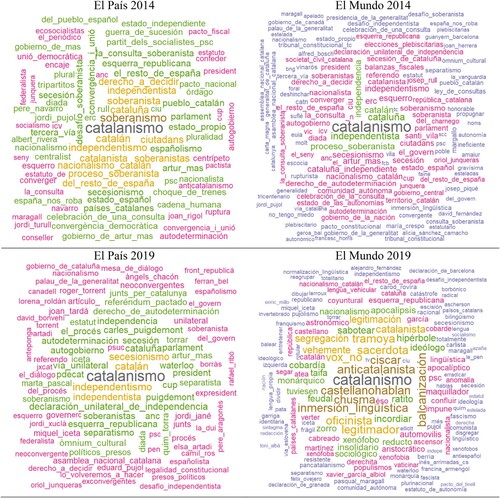
Figure 10. Frames cloud representing semantic association of ‘third way’.
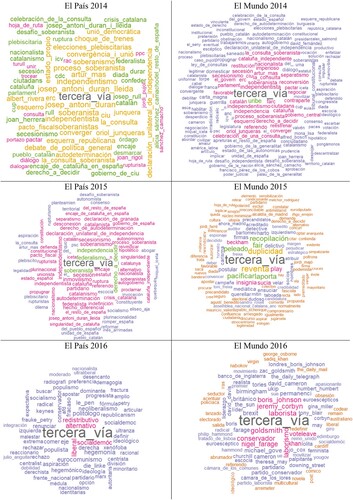
Table A1. Frobenius norm scores
Table A2. Pearson correlation coefficients between spaces generated by direct and inverse rotations.
Table A3. Pearson correlation coefficients between spaces generated by direct and inverse rotations.