Figures & data
Table 1. Overview of advanced imaging options of major XRF vendors
Table 2. Overview of HI software tools of major XRF vendors for structural and congenital heart diseases
Table 3. Overview of optimized CBCT scan and contrast infusion protocols used for structural and congenital heart disease interventions
Figure 1. Hybrid imaging during recanalization of a partial cavo-pulmonary connection of the left pulmonary artery. (A) 3D reconstruction of the pulmonary artery tree (yellow structure) and left ventricle (LV) with outflow tract (white structure). (B) 3D overlay of the pulmonary tree is used to introduce a guidewire into the left pulmonary artery. (C) Contrast injection in the pulmonary artery tree with the stent in place
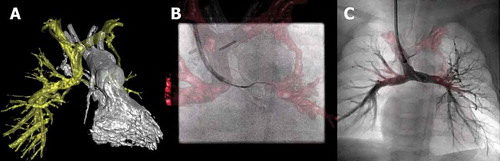
Figure 2. Hybrid imaging during TAVI. (A) 3D reconstructed DynaCT of the aortic root using Aortic Valve Guide (Siemens Healthineers) shows automatically generated aortic centerline (marked yellow dotted line), a circle of perpendicularity (marked red line), and coronary ostia markers (blue and green markers). (B, C) The cusps markers (red dots) and circle of perpendicularity enable accurate prosthesis deployment at the correct annular height
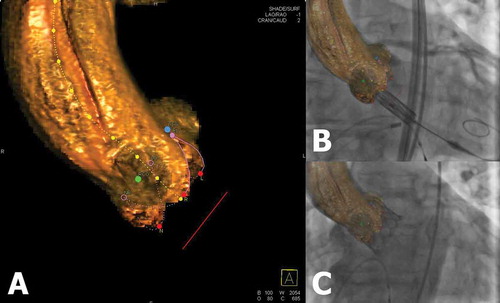
Figure 3. Hybrid imaging during stent placement in a coarctation of the aorta. (A,B) 3D reconstruction of the left ventricle and aorta (white structure) and stent in the aortic arch (blue structure), respectively shown in the AP and LAO projections. (C) 3D overlay of the aortic arch with the stent in place. The 3D roadmap is used to provide targeted stent placement and avoid obstruction of the left common carotid and left subclavian arteries
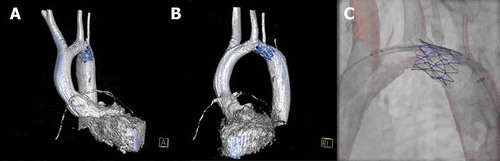
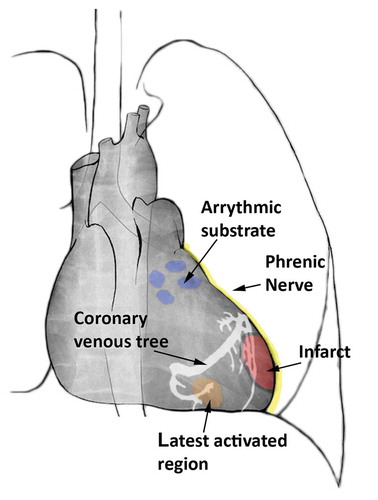
Figure 4. Schematic overview of potential 3D overlay markings onto XRF to guide cardiac resynchronization therapy (CRT) and electrophysiology cardiac interventions. The blue markings show targets for pulmonary vein isolation. In yellow the phrenic nerve is depicted, passing along the epicardium of the left ventricle. In red an infarcted region is visualized with corresponding border zone marked in black. The orange region is showing the latest activated area along with the coronary venous tree depicted in white