Figures & data
Figure 1. Study area. Source: Compiled from the published Survey of India’s Open Series Map and Taluk maps of Government of Tamil Nadu.
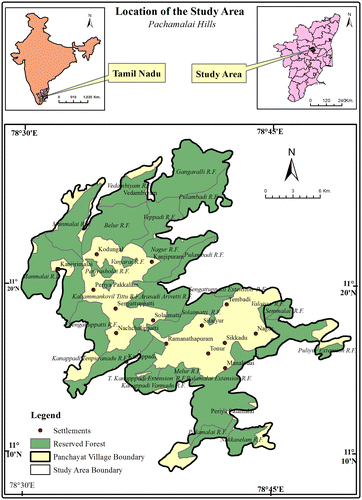
Figure 2. Administrative divisions. Source: Published Survey of India’s Open Series Map.
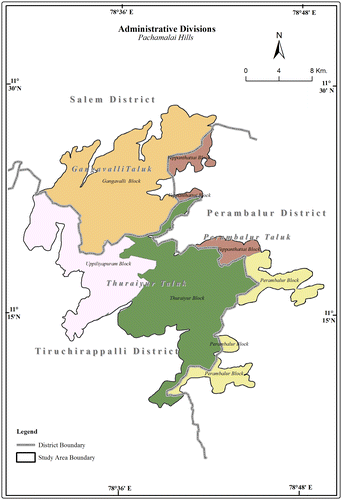
Figure 3. Rock types. Source: Geological Quadrangle Map of Salem District Published by Geological Survey India.
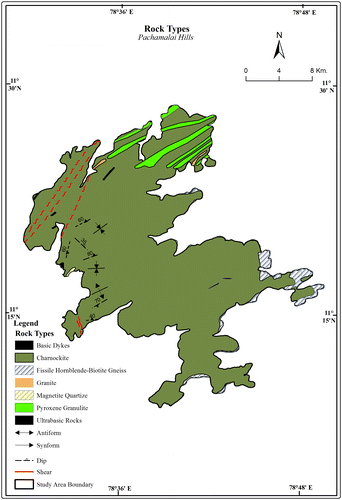
Figure 4a. Lineaments extracted by 45 degree azimuth angle.
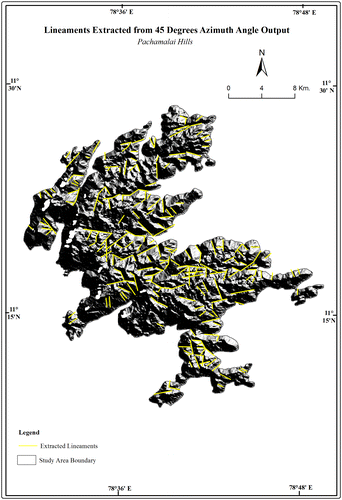
Figure 4b. Lineaments extracted by 90 degree azimuth angle.
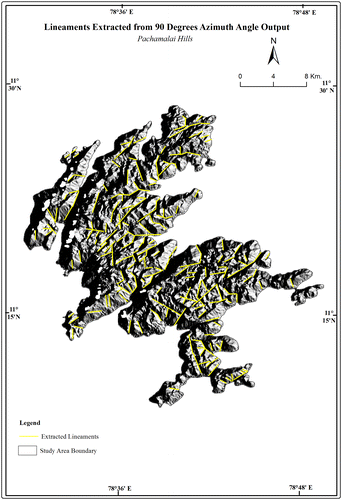
Figure 4c. Lineaments extracted by 135 degree azimuth angle.
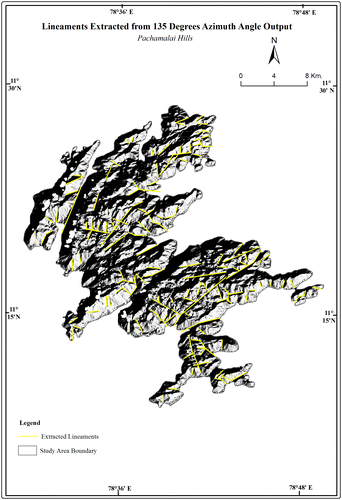
Figure 4d. Lineaments extracted by 180 degree azimuth angle.
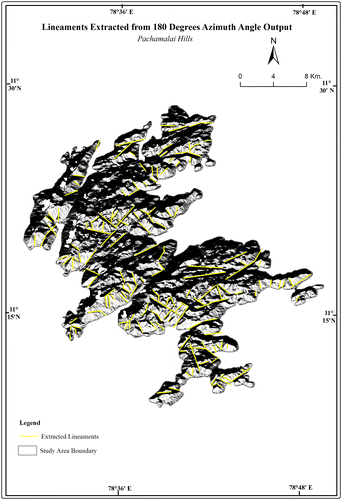
Figure 4e. Lineaments extracted by 225 degree azimuth angle.
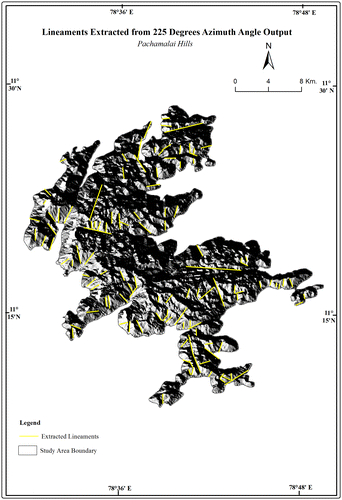
Figure 4f. Lineaments extracted by 270 degree azimuth angle.
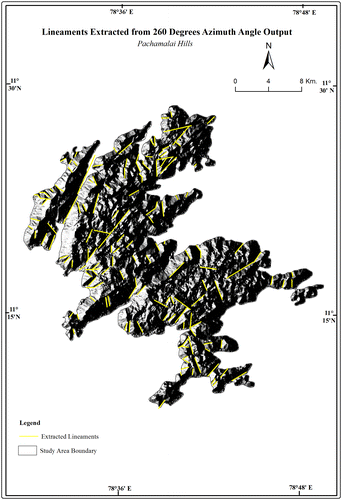
Figure 4g. Lineaments extracted by 315 degree azimuth angle.
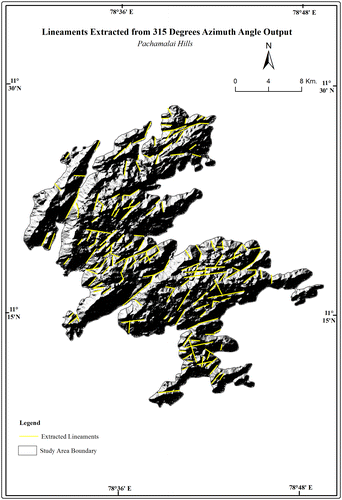
Figure 4h. Lineaments extracted by 360 degree azimuth angle.
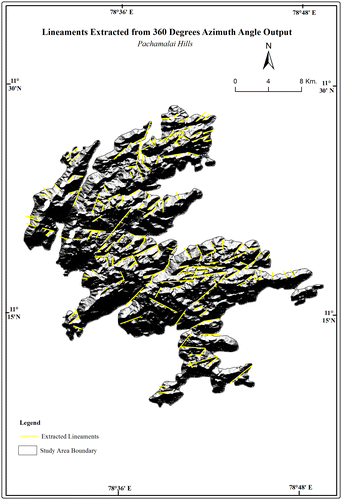
Figure 5. Final output.
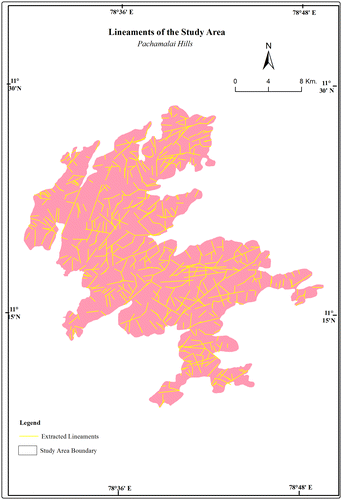
Table 1. Number of lineaments and length from various azimuth angles.
Figure 6. Lineament density. Source: Generated from Cartosat -1 Satellite’s DEM Data.
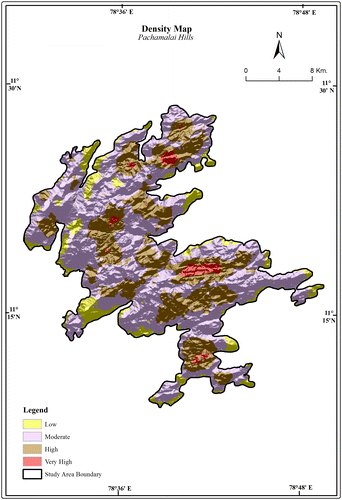
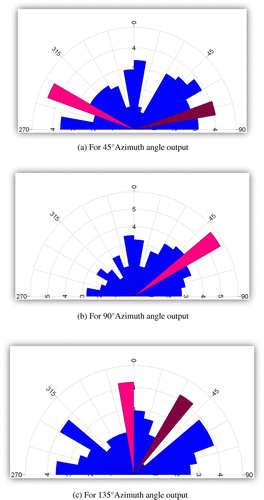
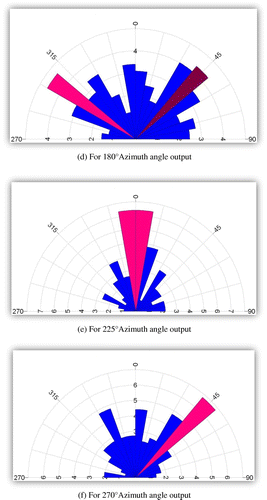
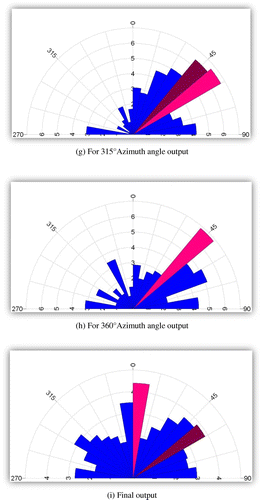
Table 2. Number of lineaments and length of various lineament length classes.