
Figures & data
Table 1. Wastes components and environmentally significant constituents from drilling activities (adopted from Bashat, Citation2002).
Figure 1. Location map of the study area.
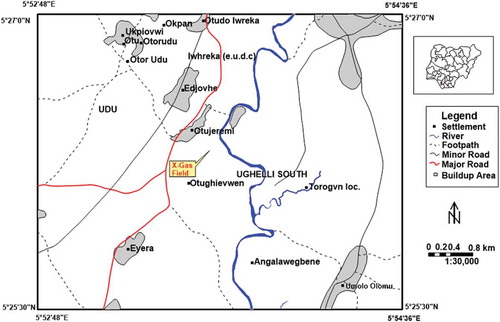
Figure 2. Geological map of the study area.
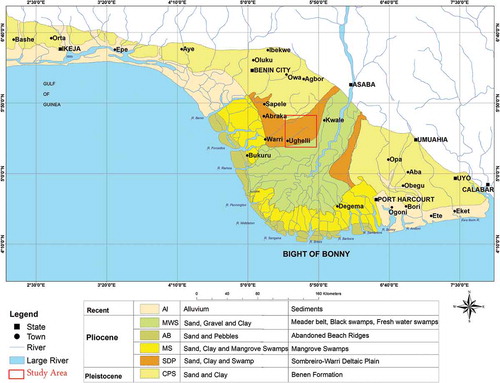
Figure 3. Arrows showing solid control units on drilling site.
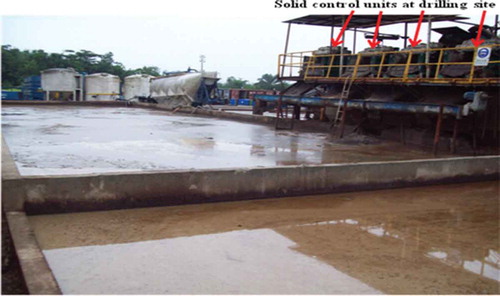
Figure 4. Flocculation unit of the dewatering system.
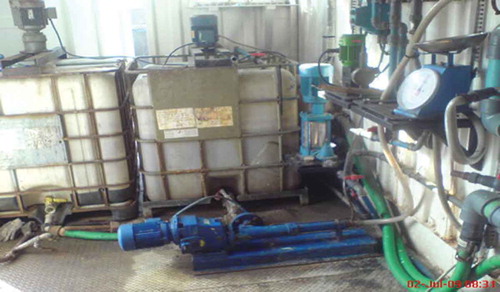
Figure 5. Coagulation unit of dewatering system.
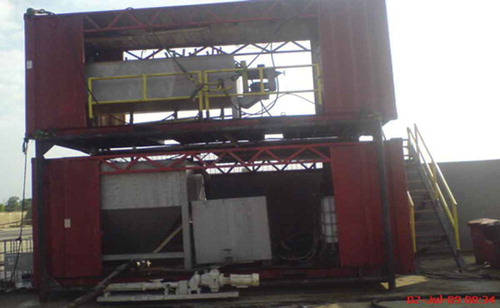
Figure 6. Flow chart of drilling waste management in X-Gas Field, Niger Delta Nigeria.
Table 2. Physiochemical analysis of drill cuttings at drilling point.
Table 3. Physiochemical analysis of drilling mud at drilling point.
Table 4. Physiochemical analysis of waste from waste pit.
Table 5. Results of analysis on sample after TDU operation.
Figure 7. pH concentration in the drill cuttings and mud.
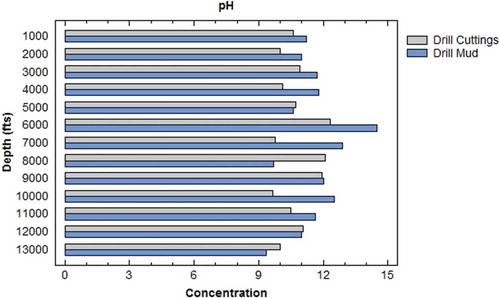
Figure 8. Copper, lead, and nickel concentrations in the drill cuttings and mud.
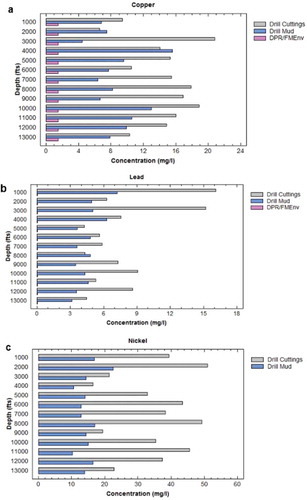
Figure 9. THC, BOD, and COD concentrations of drilling waste pit samples.
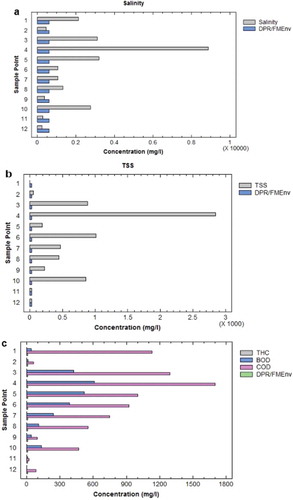
Figure 10. Average values of analyzed parameters from X-Gas Field after TDU operations against DPR/FMEnv limit.
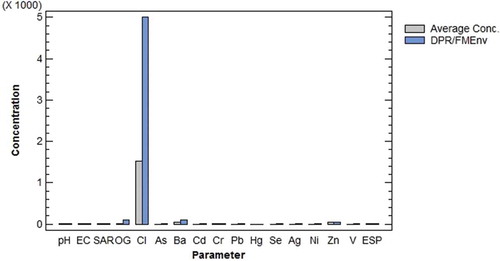
Table 6. Correlation matrix between physico-chemical parameters.
Table 7. Correlation matrix between heavy metals.