
Figures & data
Figure 7. Column chart comparing the C/N ratio in terms of mean ± SEM.
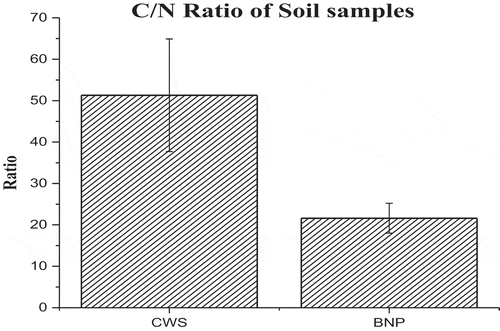
Table 1. Comparision of soil physico-chemical parameters of CWS and BNP.
Figure 1. Maps of study area.
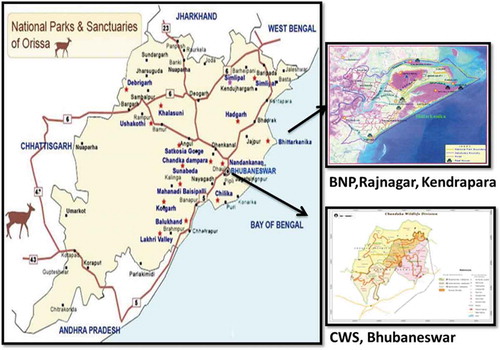
Figure 2. Box and Whisker charts of CWS and BNP soil texture.
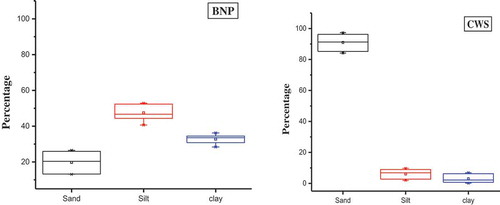
Figure 3. SEM micrographs of soil samples recorded at different magnifications: 5 µm and 10 µm.
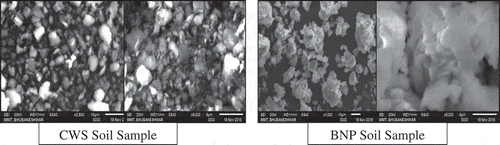
Figure 4. FT-IR spectra of CWS and BNP soil samples.
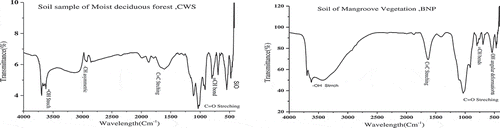
Figure 5. Comparative line – graph re-presenting FT-IR spectra of raw and H2O2-treated soil samples.
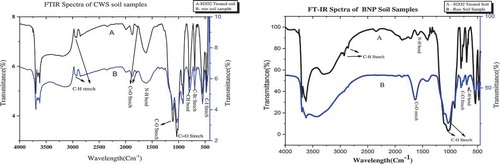
Figure 6. A line chart showing SOC variations at CWS and BNP.
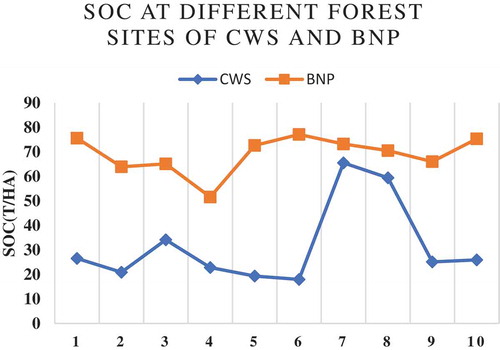
Table 2. Pearson’s correlation matrix among soil physicochemical parameters of CWS, BNP.
Table 3. SOC of different deciduous and mangrove forest areas of world.