Figures & data
Figure 1. (a) The Khaf-Kashmar-Bardskan Volcano-Plutonic Belt and Doruneh fault (Malekzadeh Shafaroudi et al., Citation2013); and (b) geological map of the study area and Sangan Magmatic Complex (modified after 1:250,000 geological map of Taybad, Geological Survey of Iran) (Sepidbar et al., Citation2018).
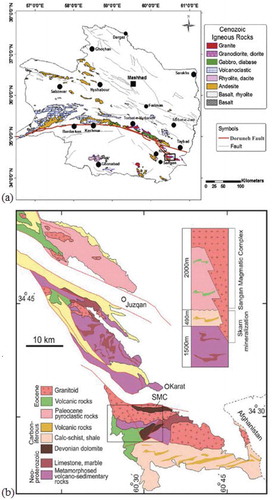
Table 1. ASTER spectral passband characteristics (Di Tommaso & Rubinstein, Citation2007).
Figure 2. FCC image based on band ratios (4/7, 3/4, 2/1 as RGB) of ASTER data.
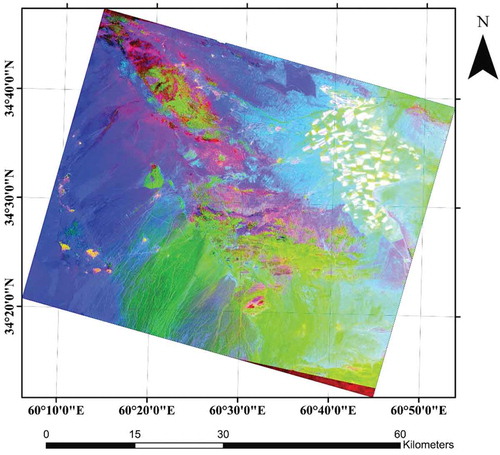
Figure 3. FCC image based on band ratios (7/6, 6/5, 6/4 as RGB) of ASTER data.
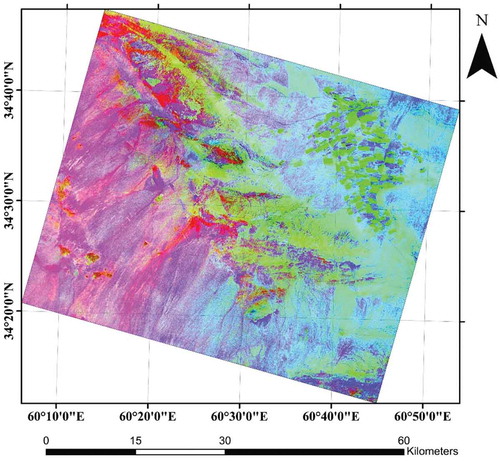
Figure 4. FCC image based on band ratios (8/5, 5/4, 7/8 as RGB) of ASTER data.
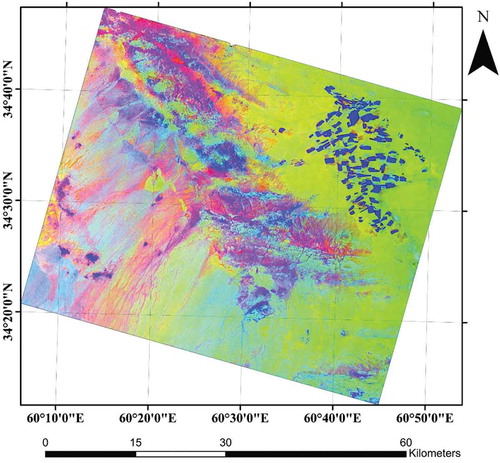
Figure 5. SAM classification result for lithological mapping in the Sangan region.
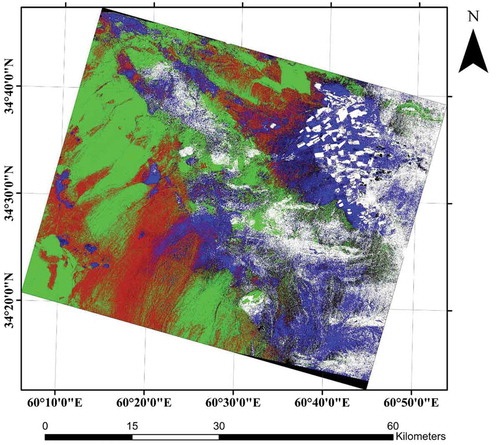
Figure 6. Geological map at a scale of 1:20,000 of SMC based on ASTER data and field observations
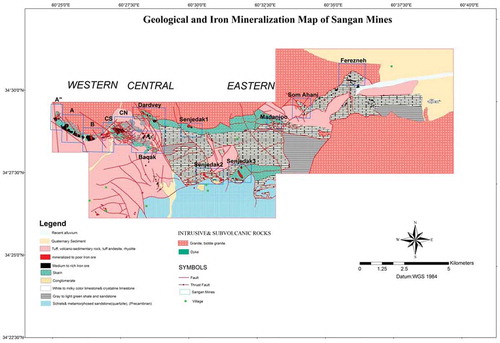
Figure 7. The field photographs of the study area during field investigation. (a) Granite; (b) Sandstone and shale; (c) Dolomite; (d) Limestone.
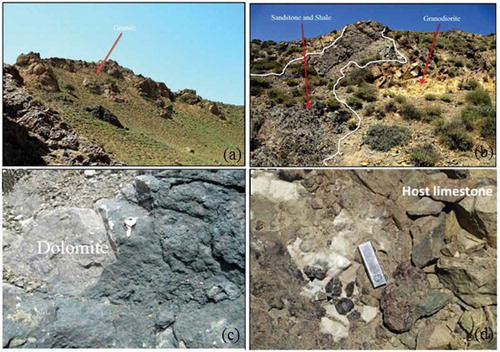
Figure 8. Classification results achieved by SVM of ASTER data in the study area.
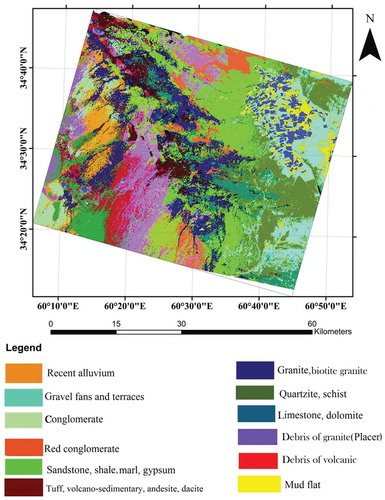
Table 2. Each class producer accuracy, user’ s accuracy and average accuracy of ASTER in the study area.
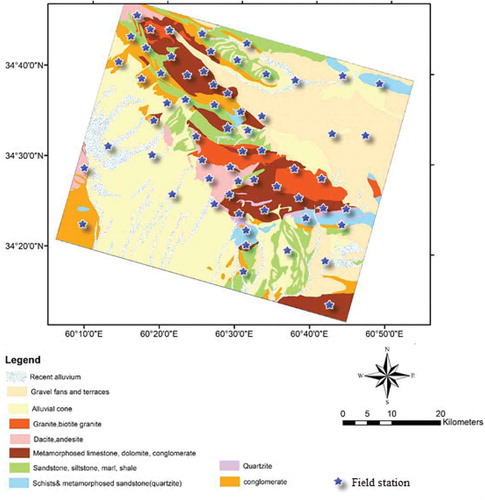
Figure 9. The final geological map with field survey points distribution of the study area.