Figures & data
Figure 1. Location of the Tabriz and Ahar synoptic stations in Iran (East Azerbaijan Province).
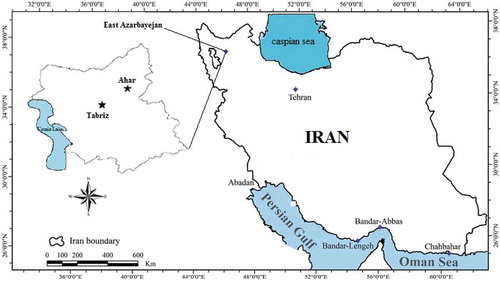
Figure 2. Simple configuration of multilayer perceptron neural network.
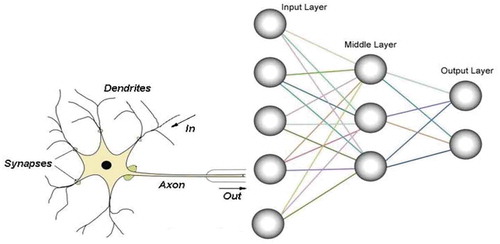
Table 1. Statistical data of climate variables of Tabriz and Ahar stations.
Table 2. Selecting different modes for modeling soil temperature estimates with a delay of 2 days for depth of 5 cm.
Table 3. The results of modeling with Pearson VII kernel function-based GP models for Tabriz and Ahar at a depth of 5 cm.
Figure 3. Comparison of actual and predicted soil temperature at 5 cm and agreement diagram for Tabriz metrological station – Pearson VII kernel function-based GP model, testing period.
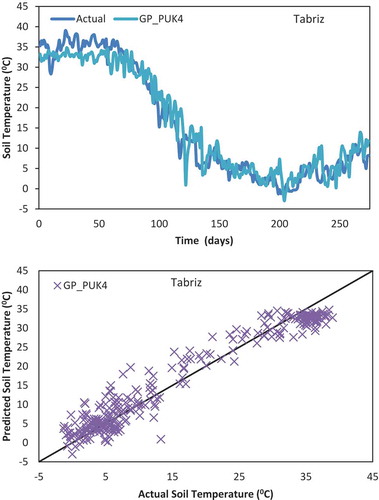
Figure 4. Comparison of actual and predicted soil temperature at 5 cm and agreement diagram for Ahar metrological station – Pearson VII kernel function-based GP model, testing period.
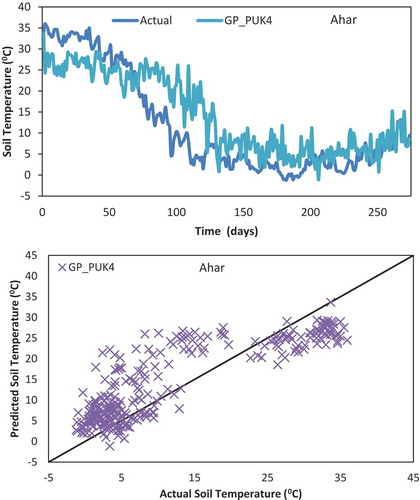
Figure 5. Comparison of actual and predicted soil temperature at 5 cm and agreement diagram for Tabriz metrological station – M5P model, testing period.
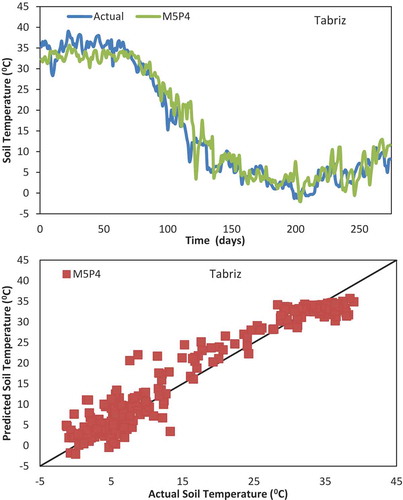
Table 4. The results of modeling with M5P models for Tabriz and Ahar at a depth of 5 cm.
Figure 6. Comparison of actual and predicted soil temperature at 5 cm and agreement diagram for Ahar metrological station – M5P model, testing period.
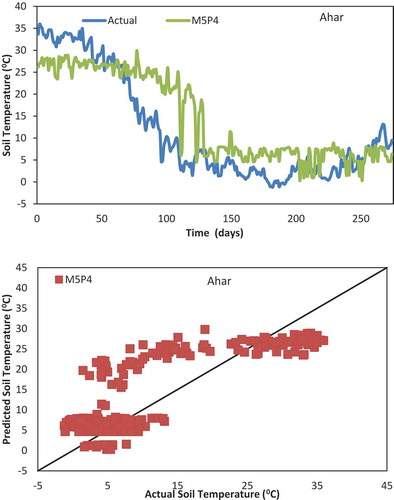
Table 5. The results of modeling with RF models for Tabriz and Ahar at a depth of 5 cm.
Figure 7. Comparison of actual and predicted soil temperature at 5 cm and agreement diagram for Tabriz metrological station – RF model, testing period.
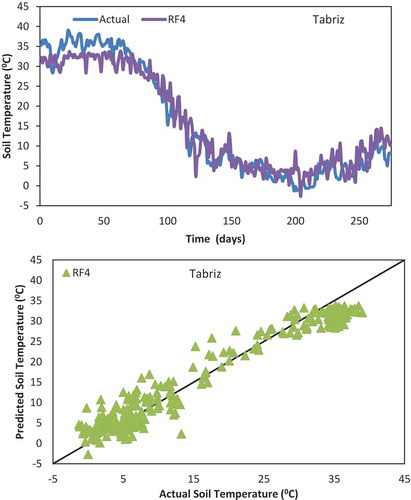
Figure 8. Comparison of actual and predicted soil temperature at 5 cm and agreement diagram for Ahar metrological station – RF model, testing period.
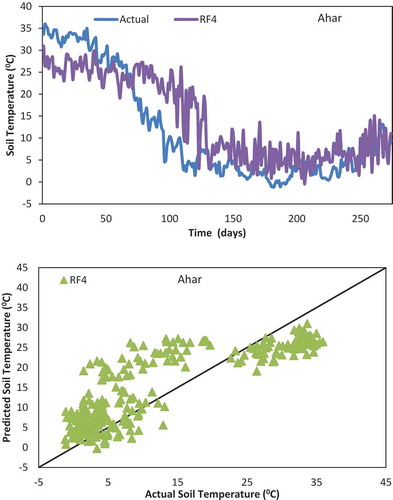
Table 6. Structure of the MLP-based model.
Table 7. The results of modeling with MLP models for Tabriz and Ahar at a depth of 5 cm.
Figure 9. Comparison of actual and predicted soil temperature at 5 cm and agreement diagram for Tabriz metrological station – MLP model, testing period.
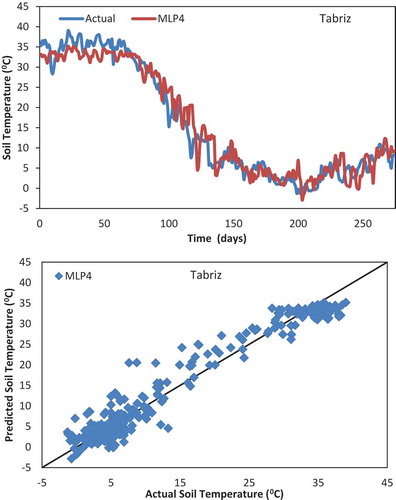
Figure 10. Comparison of actual and predicted soil temperature at 5 cm and agreement diagram for Ahar metrological station – MLP model, testing period.
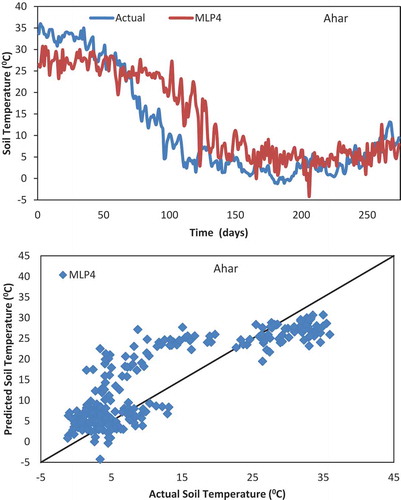
Table 8. The results of different modeling approaches for Tabriz at a depth of 5 cm.
Figure 11. Agreement plot of actual and predicted values of soil temperature at 5 cm for Tabriz metrological station – using MLP, M5P, RF, and GP-based models model, testing period.
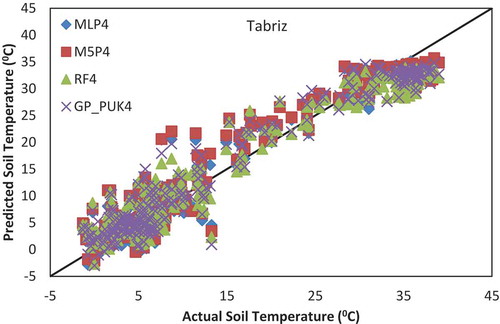
Table 9. The results of different modeling approaches for Ahar at a depth of 5 cm.
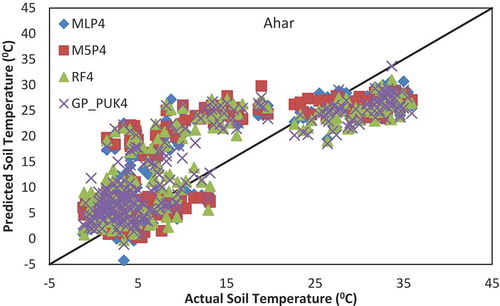
Figure 12. Agreement plot of actual and predicted values of soil temperature at 5 cm for Ahar metrological station – using MLP, M5P, RF, and GP-based models model, testing period.