Figures & data
Figure 1. Location map of the study area.
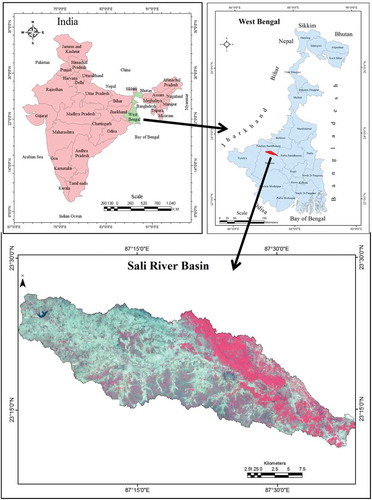
Table 1. Climatic condition of study area.
Table 2. Details of satellite data.
Figure 2. NDVI of Sali River for the month of January (left) and February (right).
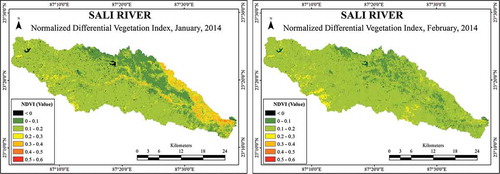
Figure 3. NDVI of Sali River for the month of March (left) and April (right).
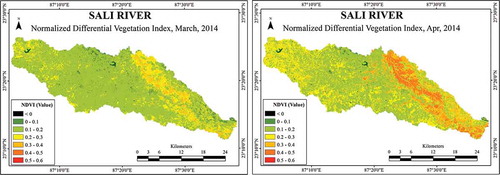
Figure 4. NDVI of Sali River for the month of May (left) and June (right).
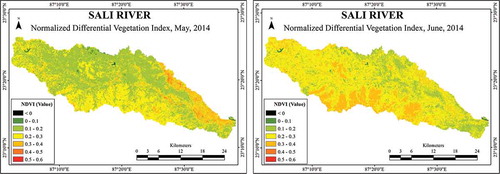
Figure 5. NDVI of Sali River for the month of August (left) and October (right).
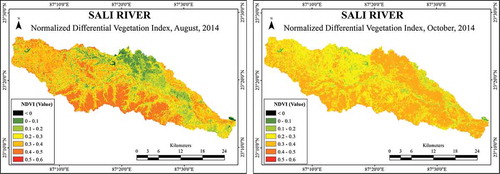
Figure 6. NDVI of Sali River for the month of November (left) and December (right).
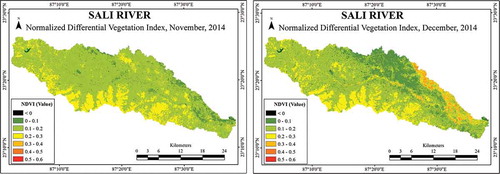
Figure 7. Pixel wise variation of NDVI, S.D. of NDVI (left) and C.V. of NDVI (right).
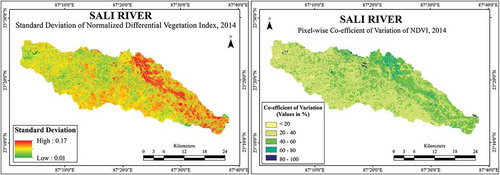
Figure 8. Month wise Variation of NDVI.
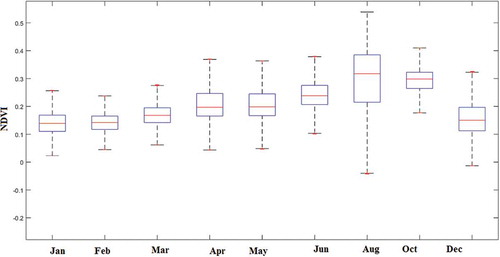
Figure 9. Comparative representation of NDVI.
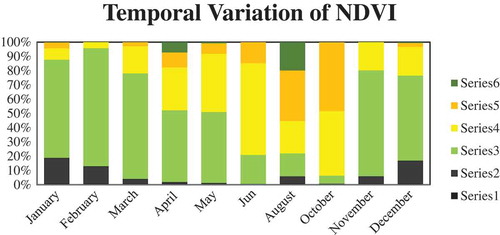
Figure 10. Month wise distribution of NDVI.
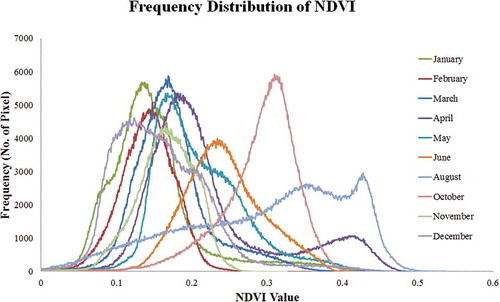
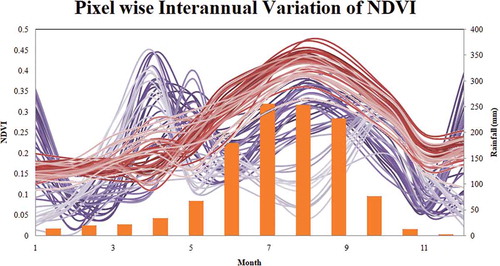
Figure 11. Intra-annual variation of NDVI and distribution of rainfall in this area.