
Figures & data
Figure 1. Location map of Periyar Tiger Reserve
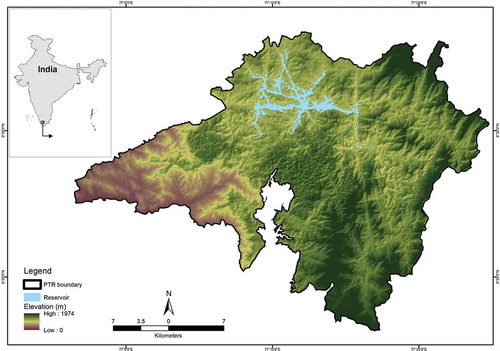
Figure 2. (a) Average annual potential evapotranspiration; (b) plant available water content; (c) soil depth; (d) land use and land cover; (e) average annual precipitation; and (f) watershed and sub-watersheds
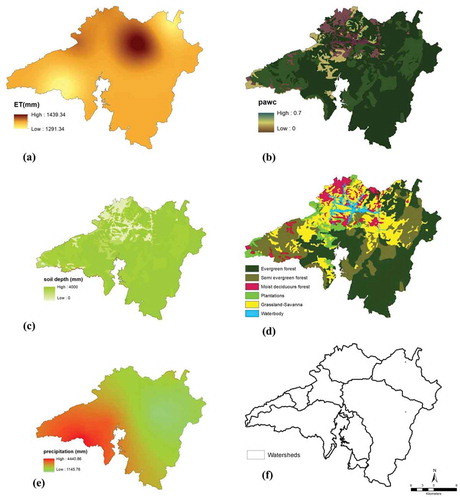
Table 1. Land cover statistics and their classification in PTR
Table 2. Biophysical details for PTR
Figure 3. Water yield map of PTR
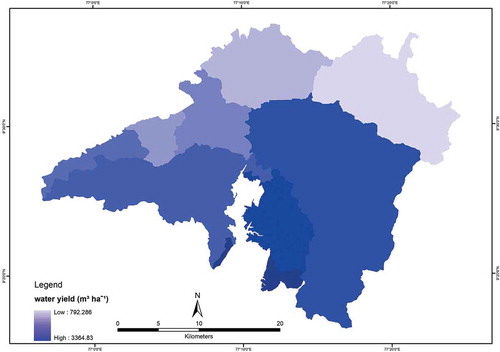
Figure 4. Water yield ratio of different forest ecosystems in PTR
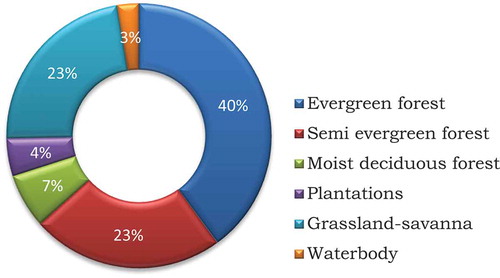
Table 3. Area and water yield percentage of different ecosystems in PTR
Figure 5. Water yield of different forest ecosystems in PTR
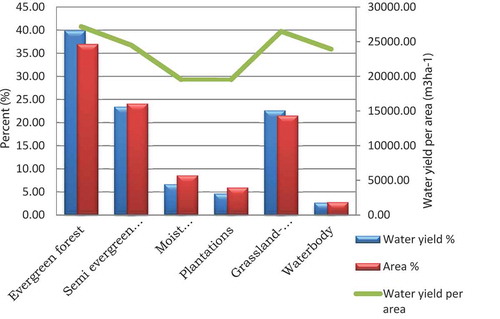
Table 4. Periyar and Pamba rivers' ratio of different ecosystems