Figures & data
Figure 1. Study area map of Addis Ababa and the surrounding Oromiya
Table 1. The Landscape metrics selected for detailed landscape- and class-level analysis
Table 2. Accuracy assessment result by study period
Figure 2. The Land use-land use/land cover map of the study area
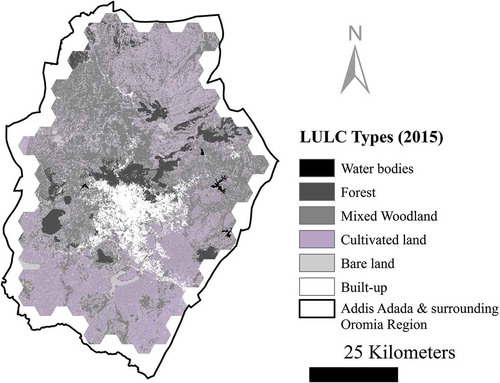
Table 3. Summary statistics of 39 computed metrics for hexagonal regions at landscape and class levels
Figure 3. Correlation coefficient of all computed landscape metrics (a) landscape-level correlation matrix and (b) forest class-level correlation matrix
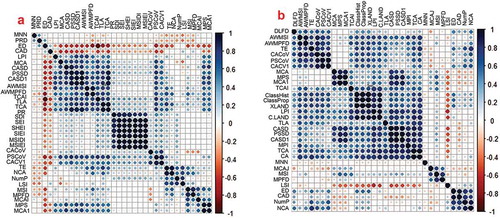
Table 4. Factor varimax rotated matrix for the selected class- and landscape-level metrics
Figure 4. Landscape-level landscape metrics pattern
Figure 5. Forest class-level landscape metrics pattern