Figures & data
Figure 1. Geologic map of the study area showing the survey stations
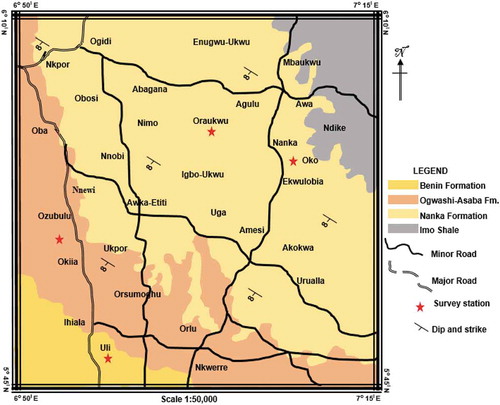
Figure 2. Drainage map showing the surface water distribution
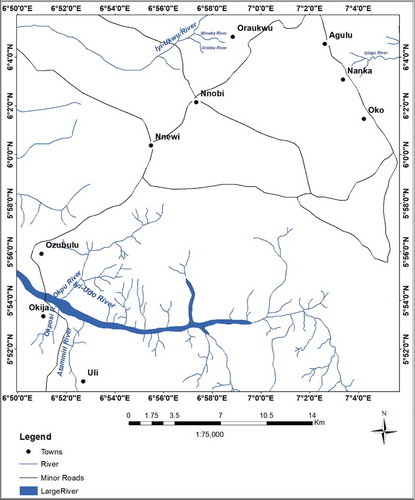
Table 1. The surface water distribution and measurements
Table 2. Interpretation of the resistivity data (Based on Elkhedr, Mohamed, Ahmed, & Laust, Citation2004; Loke, Citation1999; Telford, Gilbert, & Sheriff, Citation1977)
Table 3. The ADMT values
Figure 3. The VES models for the four stations
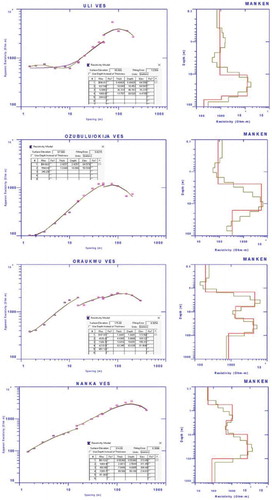
Figure 4. The ADMT models for the stations
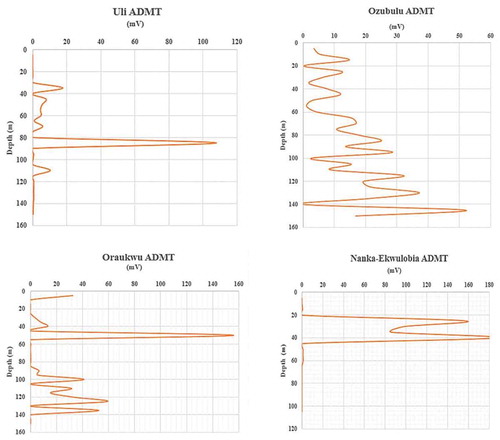
Table 4. Analyzed geotechnical properties of the soils
Figure 5. Model showing the aquiferous layers
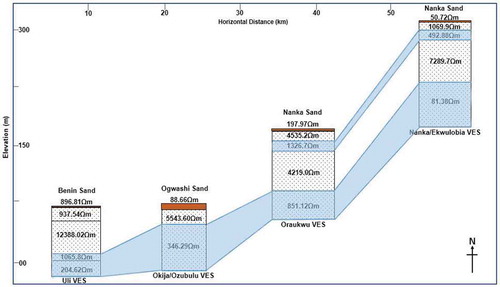
Table 5. The gully slope components
Figure 6. 2D, 3D maps showing the topography of the area
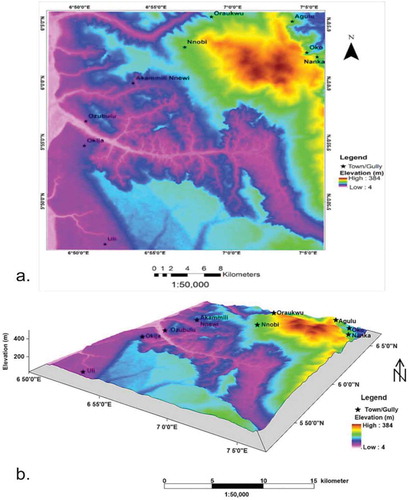
Figure 7. Various slope outlooks at Nanka-Ekwulobia gullies. Red circles and arrows show building structures at the verge of collapse
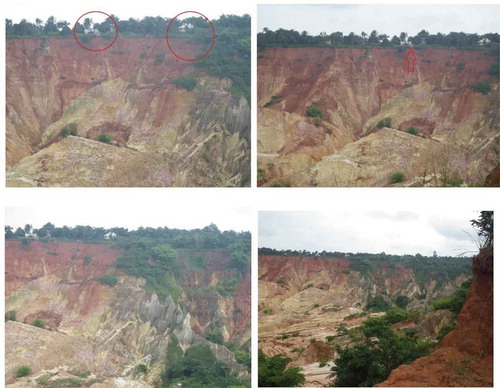
Table 6. Gully attributes and intensity measurements
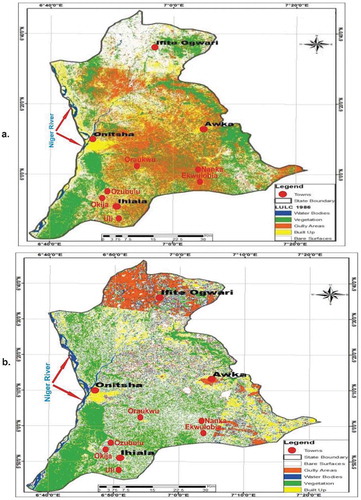
Figure 8. Land use/land cover maps for (a) 1986 and (b) 2013 (modified after Ifeka & Akinbobola, Citation2015)