Figures & data
Figure 1. (a) Location map of the study area, Southern Cameroon. (b) Drainage system of the Southern Cameroon. Various streams or tributaries flowing within this basin drain into the Lokoundje River, a major river that drains into the atlantic ocean. The area of study within this basin is the Tchangue-Bikoui drainage system. (c) Sample location map within the Tchangue-Bikoui drainage system. In all 50 samples were collected from active stream sediments.
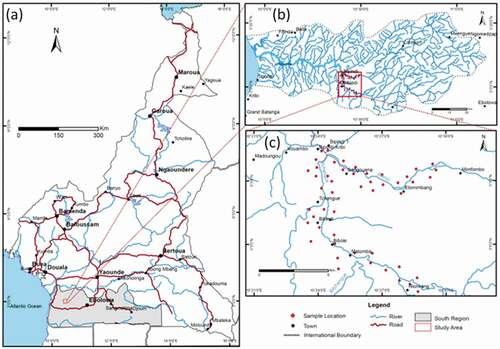
Figure 2. Lithostructural map of Cameroon (modified from Caron et al., Citation2010) showing the major structural domains in Cameroon. Red box shows the location of the Tchangue-Bikoui drainage system within the Nyong Paleoproterozoic series, Southern Cameroon.
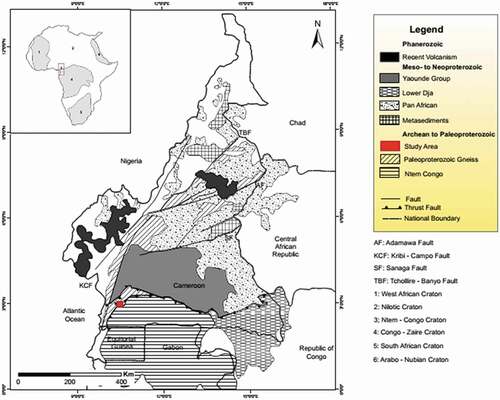
Figure 3. Graduated symbol plot for visible Au by panning and weighing technique (g/t) superimposed on the drainage map of the Tchangue – Bikoui drainage area, South Cameroon. Large red bubbles indicate locations with elevated Au content.
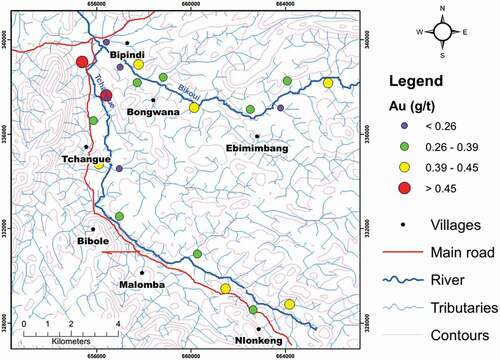
Table 1. Basic statistical parameters for stream sediment geochemical data obtained from the study area
Table 2. Pearson’s linear correlation coefficient matrix derived from stream sediment samples
Table 3. Main factors (sum of squares of loadings >1) loading, communalities, explained variance and proportion of total variance for stream sediment samples from the Tchangue-Bikoui drainage system, South Cameroon
Figure 4. Graduated symbol plot for (a) Au (ppb), (b) Ni (ppm), (c) V (ppm) and (d) Sr (ppm) superimposed on the drainage map of the Tchangue – Bikoui drainage area, South Cameroon. High positive scores (large bubbles) indicate locations with anomalous concentrations.
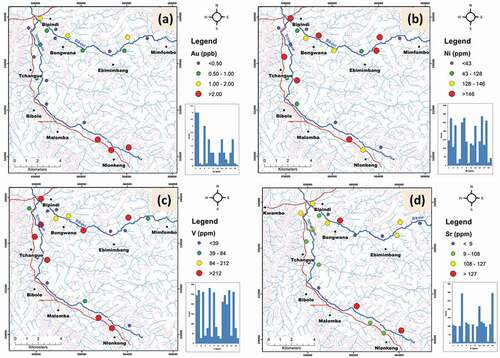
Figure 5. Graduated symbol plot for (a) Mo (ppm), (b) Cr (ppm), (c) Hg (ppm), (d) Ag (ppm), (e) As (ppm) and (f) Zr (ppm) superimposed on the drainage map of the Tchangue – Bikoui drainage area, South Cameroon. High positive scores (large bubbles) indicate locations with anomalous concentrations.
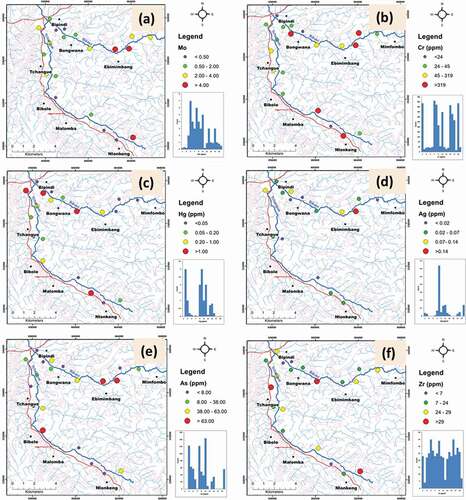
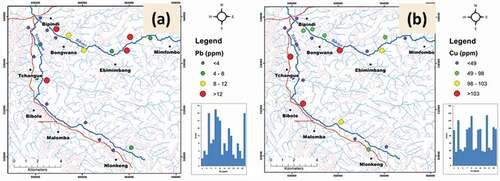
Figure 6. Graduated symbol plot for (a) Pb (ppm) and (b) Cu (ppm) superimposed on the drainage map of the Tchangue – Bikoui drainage area, South Cameroon. High positive scores (large bubbles) indicate locations with anomalous concentrations.