Figures & data
Figure 1. Location map of the study area.
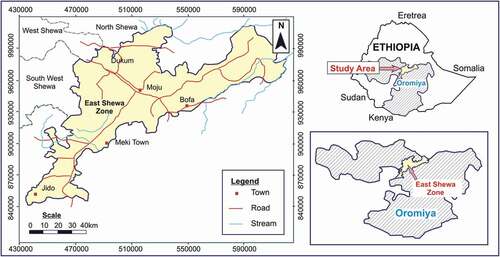
Table 1. Data used for the present study.
Figure 2. Model structure for generating optimal sites for solar farm.
Table 2. Nine-point importance scale.
Table 3. Suitability criteria and constraints for PV solar farm site selection.
Table 4. Factor criteria weights’ assignment and constraints used in the suitability model.
Figure 3. Land-use and land-cover map.
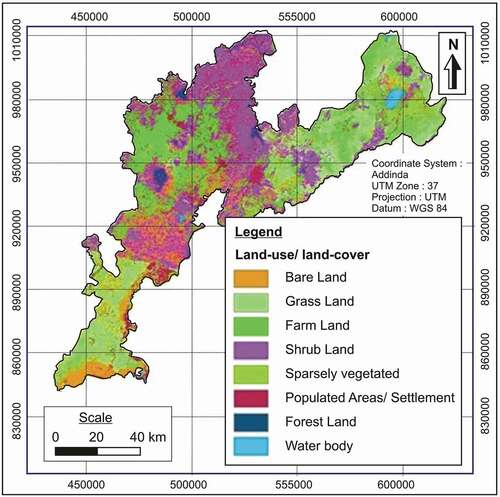
Figure 4. Global solar radiation map (a), slope map (b), and (c) aspect map.
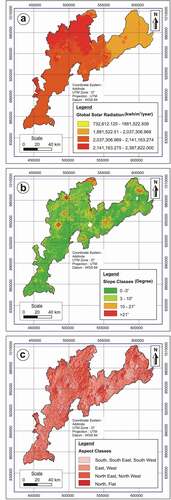
Figure 5. Distance to transmission line map (a) and (b) distance to roads map.
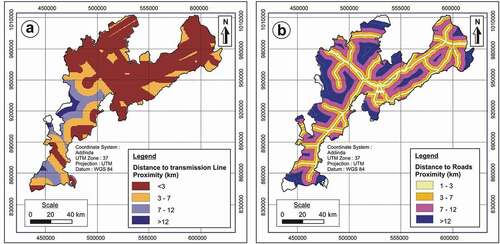
Figure 6. Urban constraints map (a) and (b) river and flood plain constraints map.
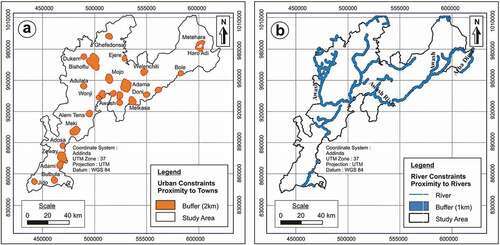
Figure 7. Monthly temporal variations of global radiation in the study area.
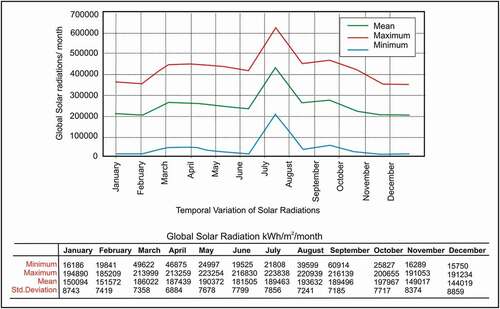
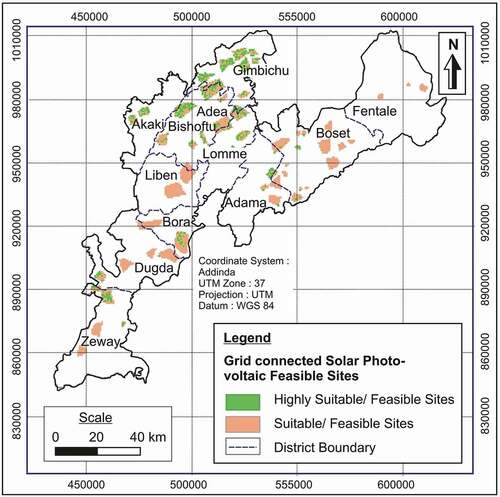
Figure 8. Suitability map for feasible grid-connected solar photovoltaic farm sites.