Figures & data
Figure 1. Location of the study area: (a) Map of Africa showing the location of Tanzania; (b) Map of Tanzania showing the location of the Kijereshi Game Reserve by a black rectangle; (c) Map of the Kijereshi Game Reserve showing the location of 15 transects laid during large mammal ground count. The boundary shared with humans was the one used to calculate the distance from the boundary which was used as a factor of proximity to humans.
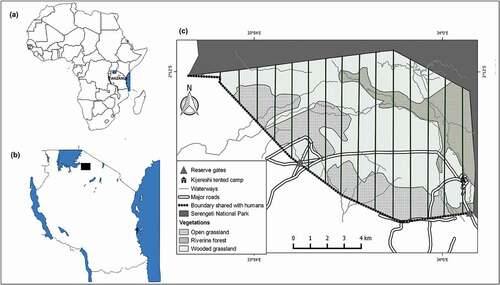
Table 1. Large mammals recorded in Kijereshi Game Reserve during a line transect survey together with number of individuals observed and their detections. A total of 698 large mammals were recorded in the surveyed area
Figure 2. Distribution of large mammals in Kijereshi Game Reserve. Black circles on the map indicate the points where large mammals were observed in relation to abundance (large circle indicates the point with higher abundance). Overlapping circles indicate the point of which more than one species was encountered. Abundance in this map is referred as number of individuals.
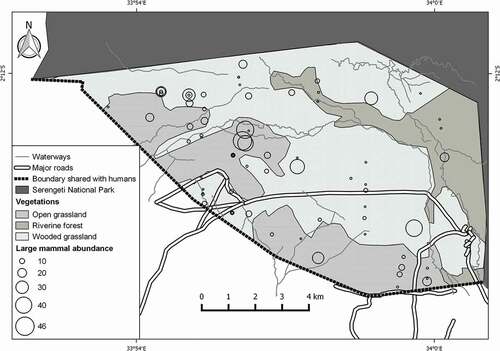
Table 2. Different combinations of models which were run to define large mammal distribution in Kijereshi Game Reserve. We adopted the default values of k and/or bs in the model which we did not specify them in the smoothed (s) and tensor (te) terms. We selected the model with lowest Akaike Information Criterion (AIC) and highest percentage of deviance explained
Figure 3. Response curves of the smoothed terms as determined by our generalized additive model (GAM). The solid line is the predicted value of the density as a function of the distance from the road (a) and distance from the waterway (b). The shaded area indicates standard error from the mean while the small lines along the x-axis (like inside tick marks) indicates sample observations.