Figures & data
Figure 1. Location map of the sediments samples site in the active glacial region of Indian Himalaya (After Carosi et al. 2018).
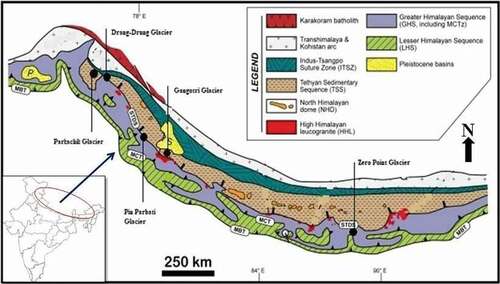
Table 1. Sedimentological characteristic in the Himalayan glacier environment.
Figure 2. Textural characteristics showing of different glaciated environment sediments.
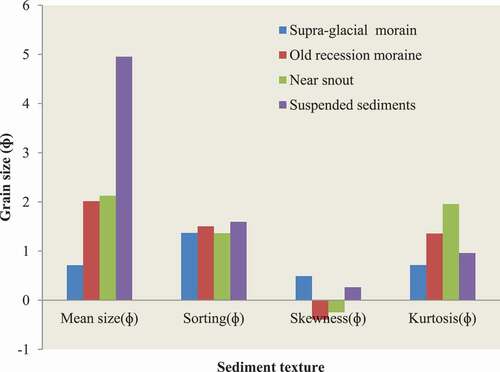
Figure 3. Bivariate plots showing different particle size mean size vs. kurtosis.
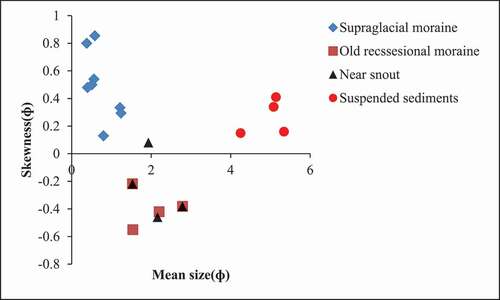
Figure 4. Bivariate plots showing different particle size mean size vs. skewness.
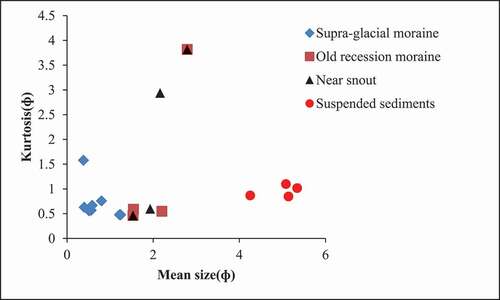
Table 2. Mineral composition % of gravel in the selected Himalayan glacier and pro-glacial environment.
Figure 5. Average mineral percentages showing of different sediment fraction in glaciated environment.
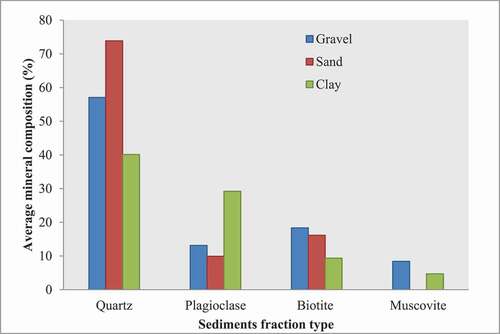
Table 3. Mineral composition % of sand in the selected Himalayan glacier and pro-glacial environment.
Table 4. Mineral composition % of Clay/silt fraction in the selected Himalayan glacier and pro-glacial environment.
Table 5. Mineral Composition of suspended sediments draining from different glaciated regions.
Figure 6. Dickinson diagram showing the provenance of sediments sources.
Figure 7. (a) Supraglacial debris derived by valley side erosion and falling on ablation zone. (b) Lateral erosion contribute the sediments on glacier surface. (c) Medial moraine contribute the sediments near glacier surface. (d) Fine material removed by Moline and coarsening the sediments at the glacier surface.
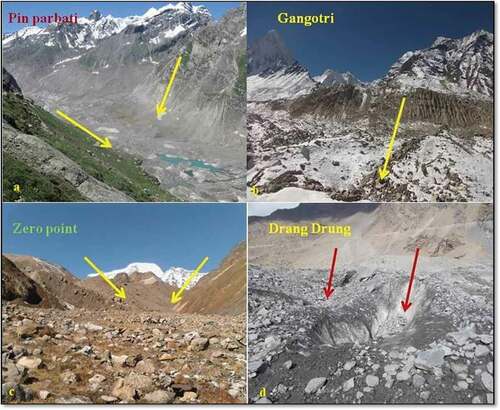
Figure 8. Subglacial till associated with fine silt and contribute into glacier meltwater stream showing in front of the Pin-Pārbati glacier snout.
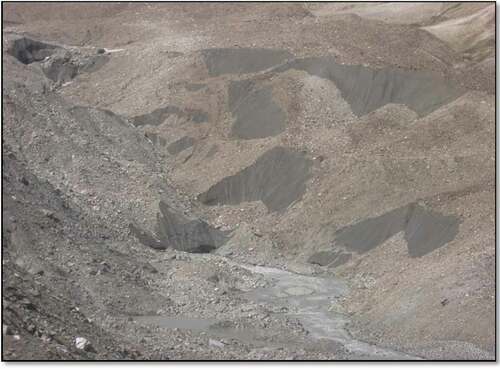
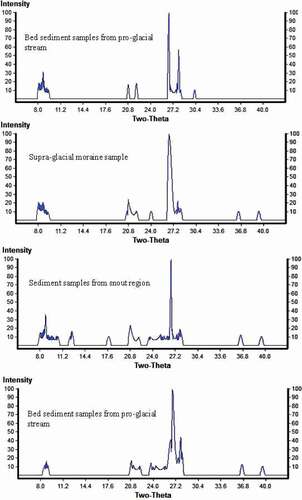
Figure 9. (a) XRD (Diffraction graph) of the samples collected from the Drang-Drung glacier. (b) XRD (Diffraction graph) of the samples collected from the Parkhachik glacier. (c) XRD (Diffraction graph) of the samples collected from the Pin-Parbati glacier.
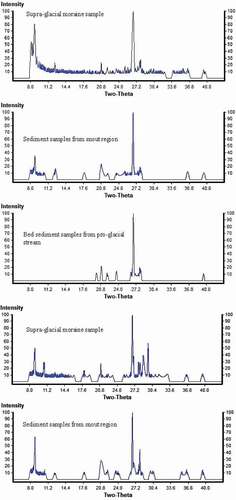
Figure 9. (Continued)