Figures & data
Table 1. Some beta diversity indices from PAST software (Hammer et al., Citation2001).
Table 2. Negentropy measures of four common indices used in ecological diversity and dominance.
Figure 1. Binary information plots for Shannon’s entropy and negentropy.
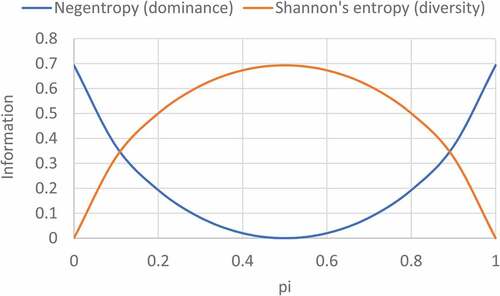
Figure 2. Binary information plots for Simpson’s dominance and diversity.
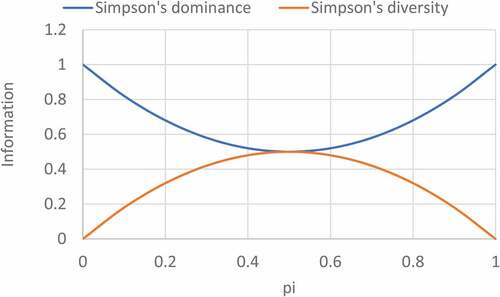
Figure 3. Negative correlation between binary Shannon’s entropy (H’) and negentropy (E’); and Simpson’s diversity (C’) and dominance (C) .
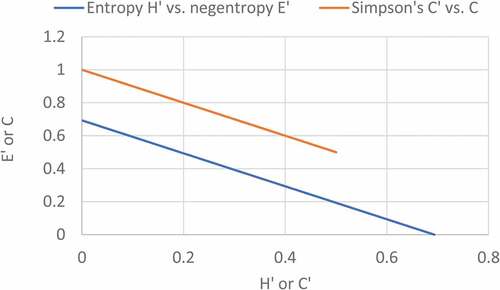
Figure 4. Binary information plots for Simpson’s inverse dominance and diversity.
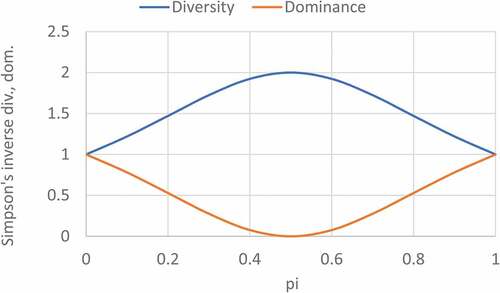
Figure 5. Binary information plots for Brillouin’s dominance and diversity.
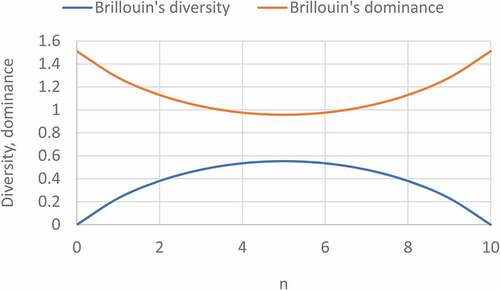
Table 3. Dominance and diversity indices in five single species communities consisting of different species with equal number of individuals.
Table 4. Dominance and diversity indices in five single species communities consisting of the same species with equal number of individuals.
Table 5. Dominance and diversity indices in five communities consisting of equal number of species with different number of individuals.
Table 6. Dominance and diversity indices in five communities consisting of different number of species with different number of individuals.
Table 7. Dominance and diversity indices along River Beas downstream from Beas to Harike, India. Data on number of individuals from six quadrats (1 sq. m each) from each community.
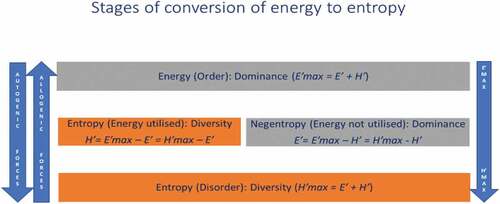
Figure 6. Conversion of energy to entropy. E’max: Maximum energy, H’max: Maximum entropy, E’: Negentropy, H’: Entropy.