Figures & data
Figure 1. Study area map of district Khanewal.
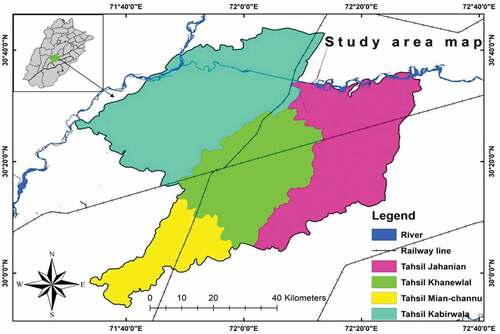
Table 1. Specification of Landsat satellite data.
Figure 2. Flow chart for methodology.
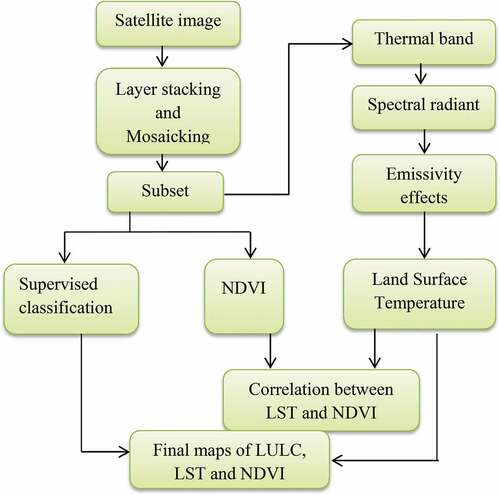
Table 2. The LULC areal distribution from 1980 to 2020 in district Khanewal.
Figure 3. The LULC maps for the years 1980, 2000 and 2020 of district Khanewal.
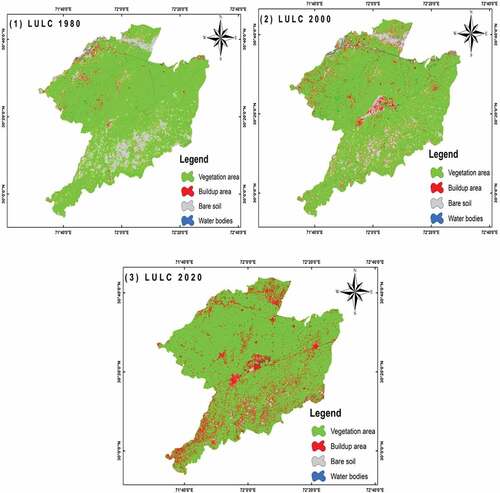
Table 3. Change analysis from 1980 to 2020 in district Khanewal.
Table 4. District Khanewal population during 1981 to 2017 (GOP, Citation2017).
Table 5. Summary of producer’s and user’s accuracy and kappa (K) coefficients in district Khanewal.
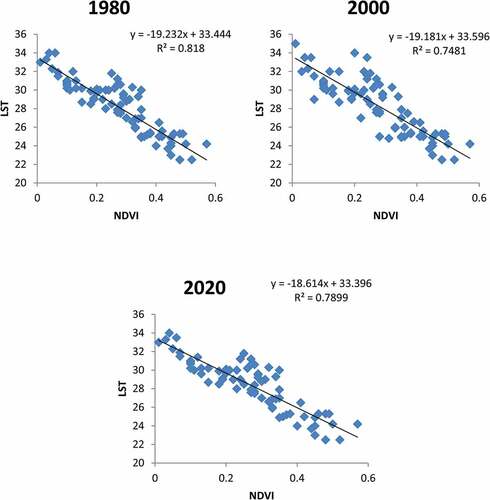
Table 6. Maximum and minimum values of LST and NDVI.
Figure 4. The LST maps for the years 1980, 2000 and 2020 of district Khanewal.
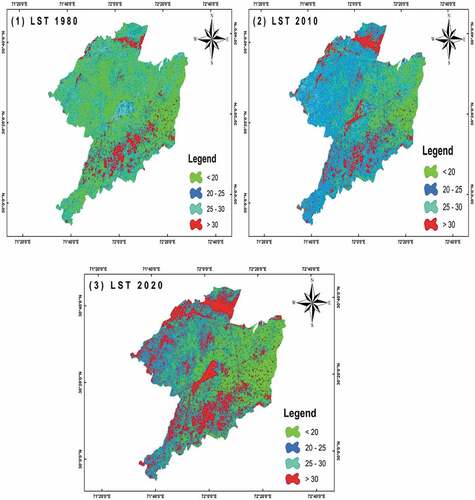
Figure 5. The NDVI maps for the years 1980, 2000, and 2020 of district Khanewal.
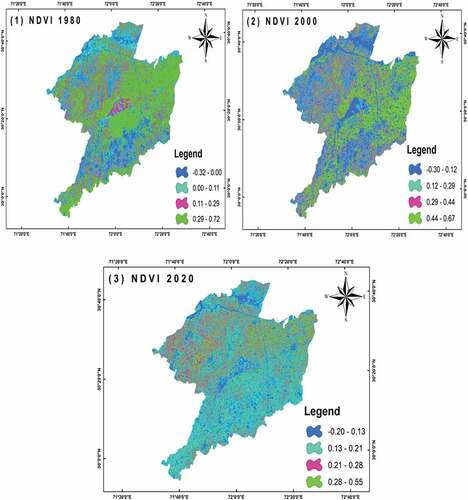
Figure 6. Relationship between LST and NDVI for the years 1980, 2000, and 2020 of district Khanewal.