Figures & data
Figure 1. Study area of Marathwada division.
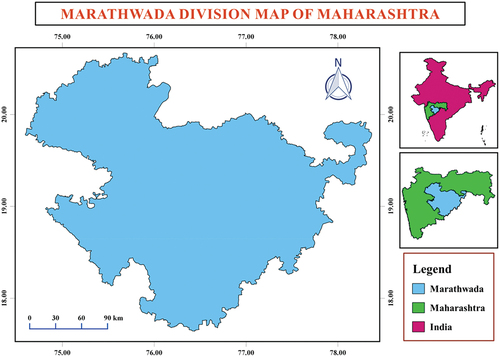
Table 1. Specifications and properties of AMSR-E.
Figure 2. Flow chart illustrating overall methodology.
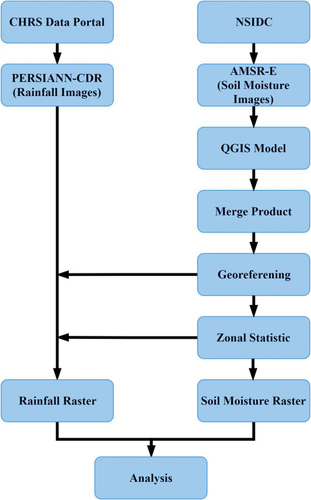
Figure 3. Ascending pass scenes depicting swaths of soil moisture data of India recorded from 1 July 2003 to 7 July 2003.
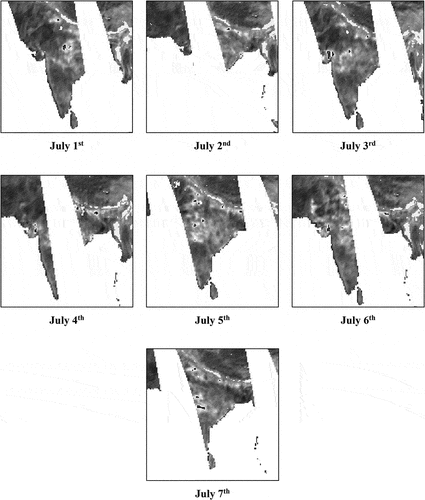
Figure 4. Descending pass scenes depicting swaths of soil moisture data of India recorded from 1 July 2003 to 7 July 2003.
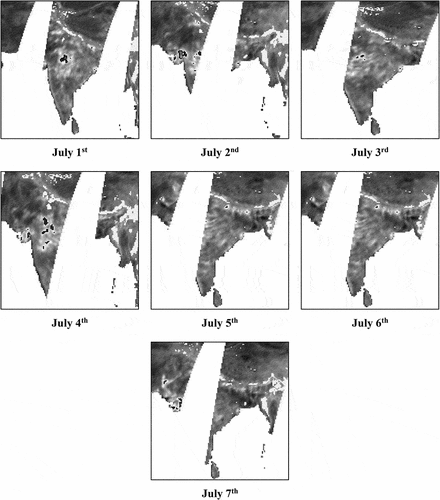
Figure 5. Graphical modeler in QGIS for soil moisture raster formation.
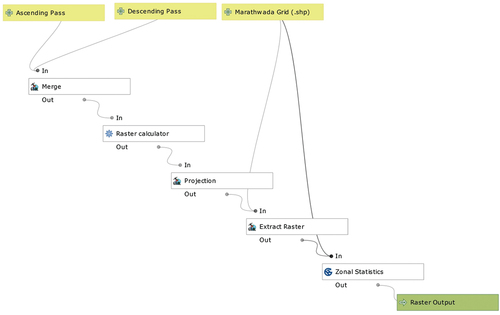
Figure 6. Daily rainfall map for 15 July 2005.
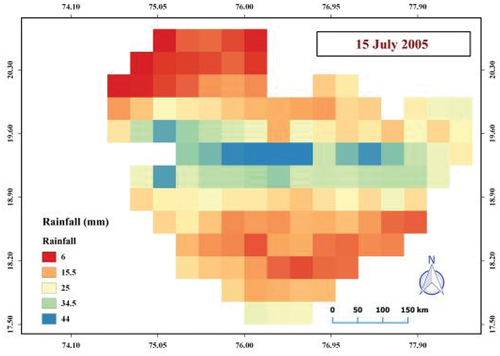
Figure 7. Weekly average soil moisture for July (2003–2005).
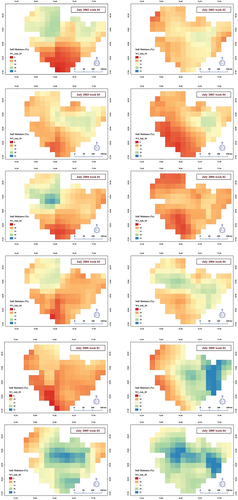
Figure 8. Monthly average soil moisture for June – September (2003–2005).
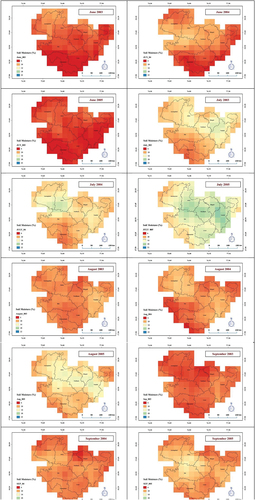
Figure 9. Seasonal soil moisture (2003–2005).
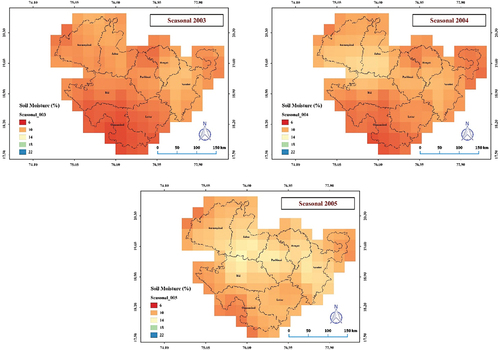
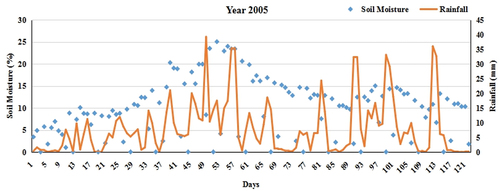
Figure 10. Soil moisture variation with time and rainfall from (June – September) in 2005.