Figures & data
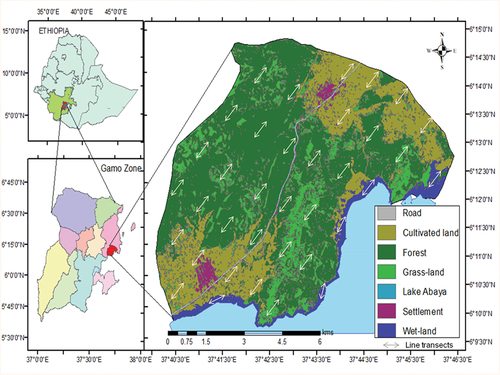
Figure 1. Location of the study area and sampled area where transect line distributed among different habitats in the study area.
Table
Table 1. List of mammalian species recorded in the FFL, their scientific names, common names, local names, and IUCN red list categories.
Figure 2. The Venn diagram showing assemblage of mammalian species in habitat types.
Note: TI, Tragelaphus imberbis; RR, Redunca redunca; OO, Ourebia ourebi; SG, Sylvicapra grimmia; PA, Phacochoerus aethiopicus; PL, Potamochoerus larvatus; HA, Hippopotamus amphibius; OA, Orycteropus afer; HC, Hystrix cristata, XR, Xerus rutilus; MM, Marmota monax; PAU, Papio anubis; CG, Colobus guereza; CP, Chlorocebus aethiops; CC, Crocuta crocuta; MC, Mellivora capensis; CIC, Civettictis civetta; PLE, Panthera leo; PP, Panthera pardus; CM, Canis mesomelas; LH, Lepus habessinicus; CP, Chlorocebus aethiops.
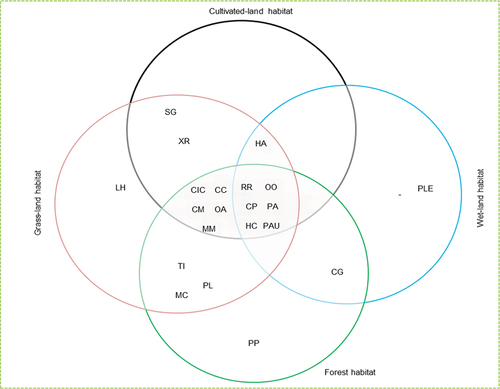
Figure 3. Mean number of species richness and frequency of records computed by rarefaction curve among the four stratified habitat types (A) and seasons (B).
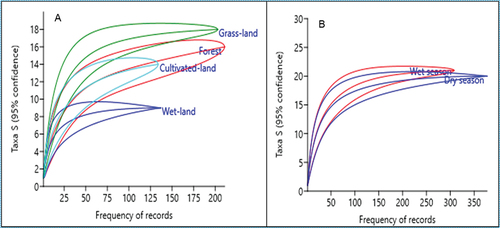
Figure 4. Mammalian species frequency of records among four habitat types.
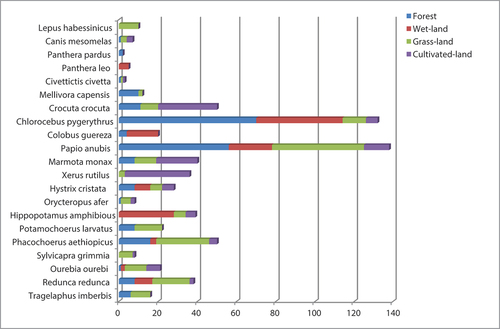
Figure 5. Mammalian species frequency of records in wet and dry seasons.
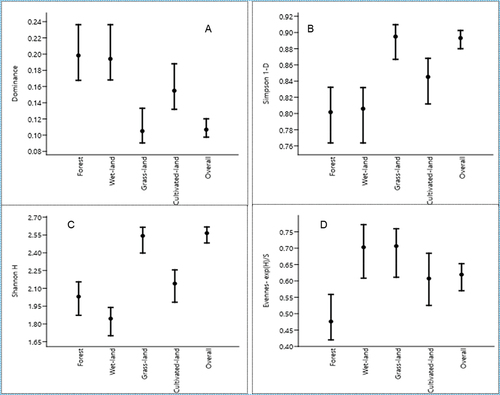
Figure 6. Error bars of mammalian species diversity indices across habitat types.