Figures & data
Figure 1. Makutupora location map.
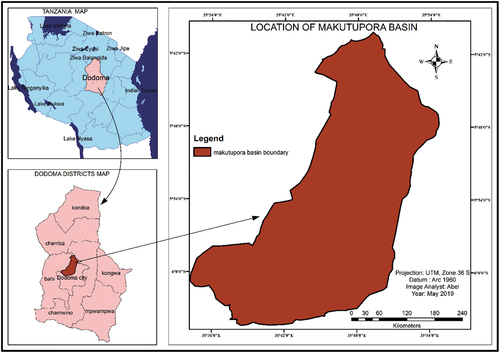
Figure 2. Layout of data process and analysis.
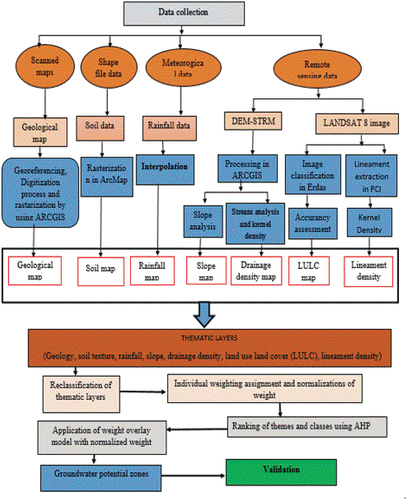
Figure 3. Relationship between factors affecting groundwater recharge.
Table 1. Weighted thematic layers and ranks.
Figure 4. Lineament map.
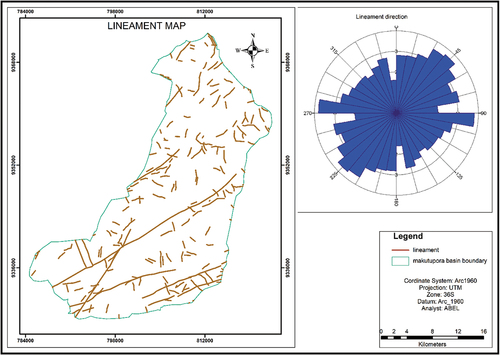
Figure 5. Lineament density map.
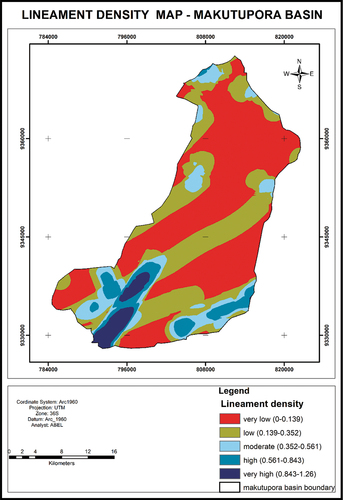
Figure 6. Drainage network map.
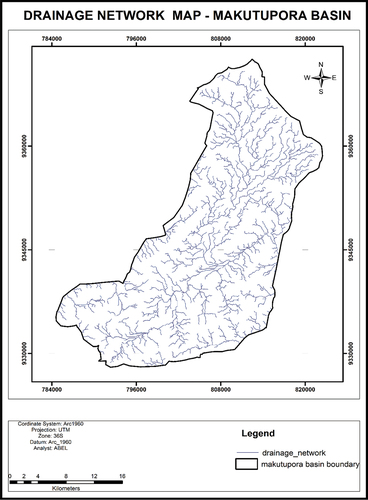
Figure 7. Drainage density map.
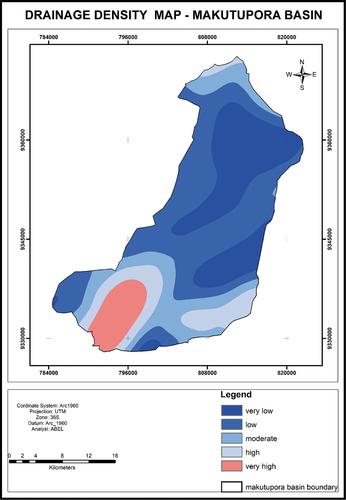
Figure 8. Slope map.
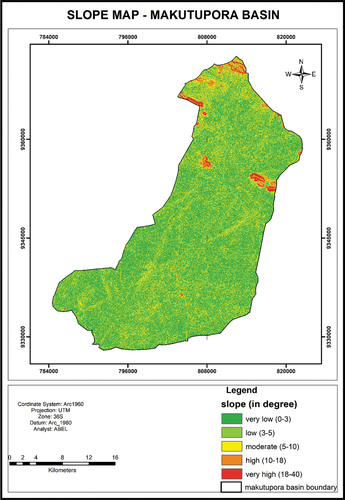
Figure 9. Geological map.
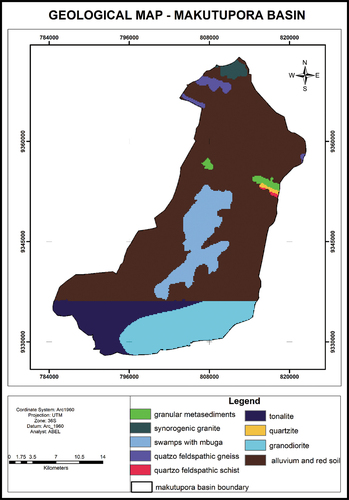
Figure 10. Land cover map.
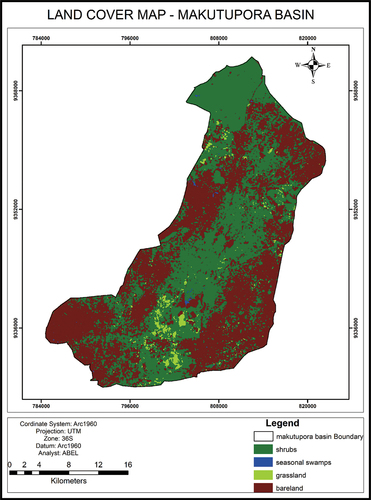
Figure 11. Rainfall map.
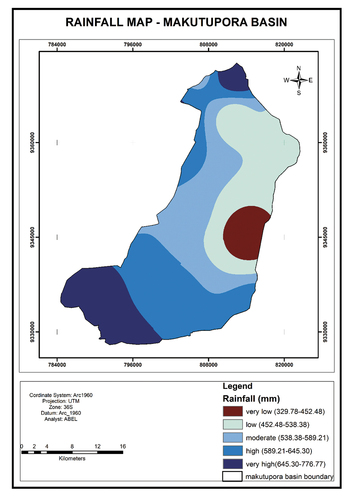
Figure 12. Soil map.
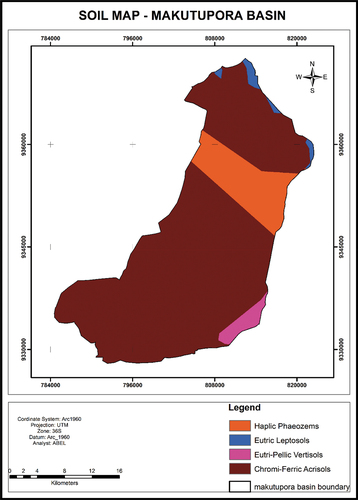
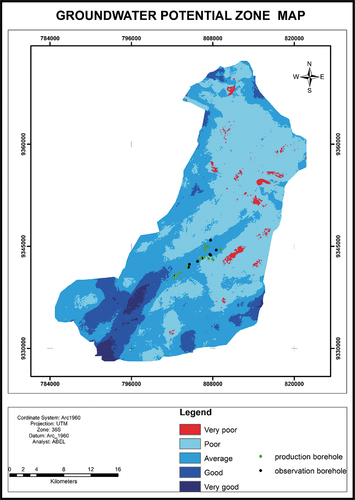
Figure 13. Potential groundwater zone map.
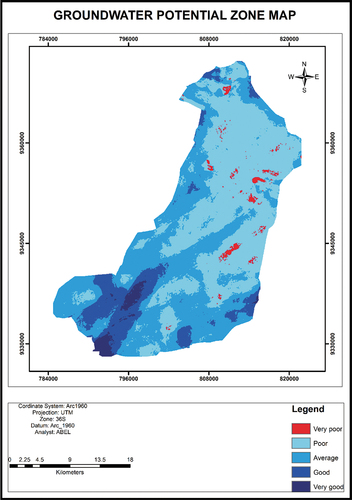
Table 2. Coverage of groundwater recharge potential zones.
Figure 14. Potential groundwater zone map with existing 26 production boreholes and 6 observation boreholes.