
Figures & data
Figure 1. Location map of the study area.
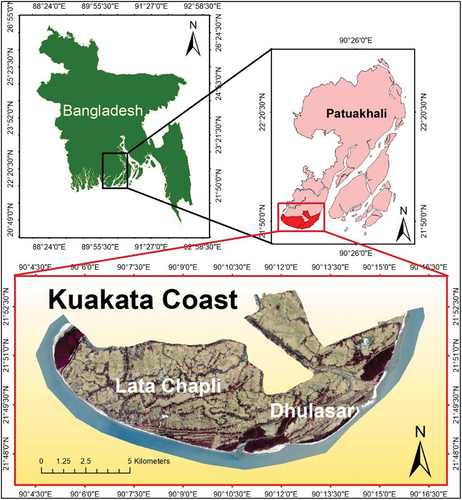
Table 1. Overview of data used.
Figure 2. Landcover classification results of Landsat images from 1989 to 2020.
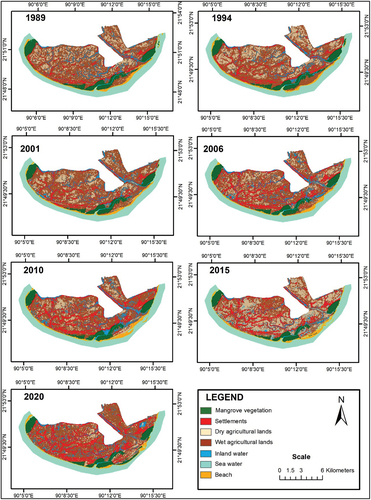
Figure 3. Total area (km2) occupied by landcover types from the year 1989 to 2020.
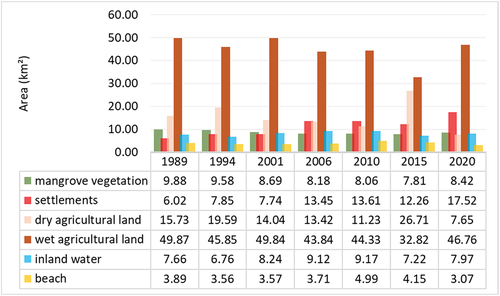
Figure 4. Generalized landcover class changes from 1989 to 2020.
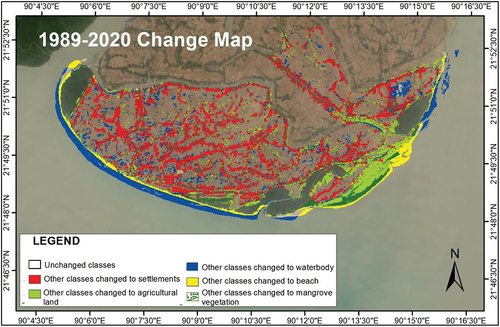
Table 2. Image classification accuracy assessment results.
Figure 5. Major interclass changes from 1989 to 2020.
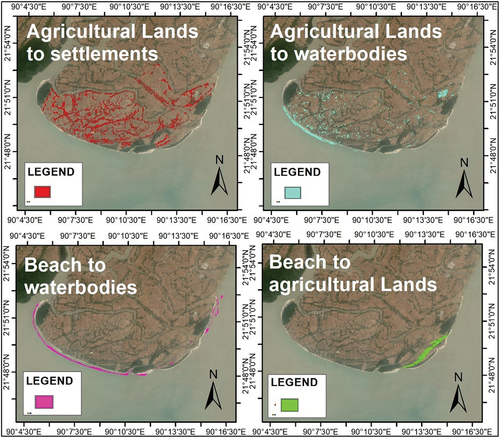
Figure 6. Major interclass changes from 2015 to 2020.
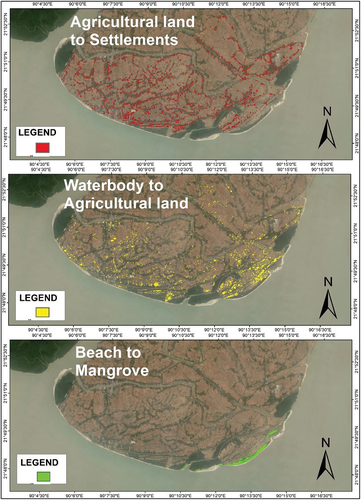
Figure 7. (a) Zones of erosion and accretion between 1989–2020; (b) LRR along the coastline.
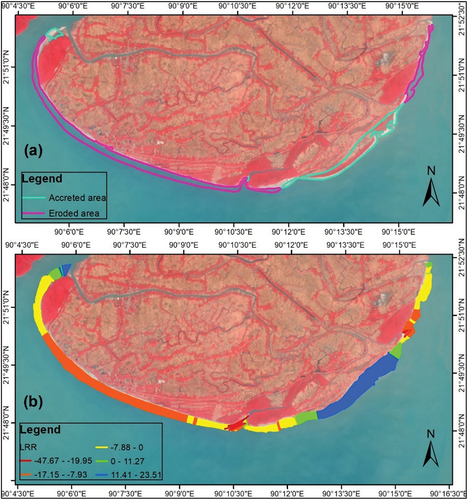
Table 3. Summary statistics of erosion rate calculation.
Figure 8. Eroded and accreted areas in Kuakata at 5-year intervals from 1989 to 2020.
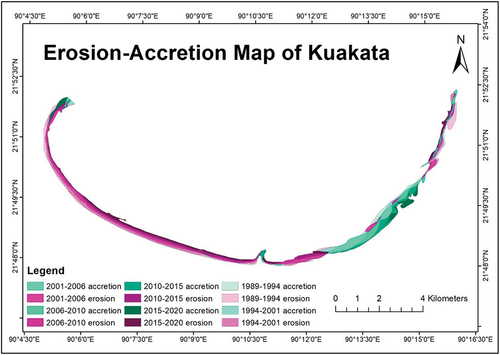
Figure 9. Landcover changes shown as percentages vs. coastline movement in km2. Negative values indicate the percentage by which the share of each landcover class has been decreased during the 5-year interval while positive values indicate an increase. The total area of coastal erosion and accretion during the time interval are shown on the secondary axis.
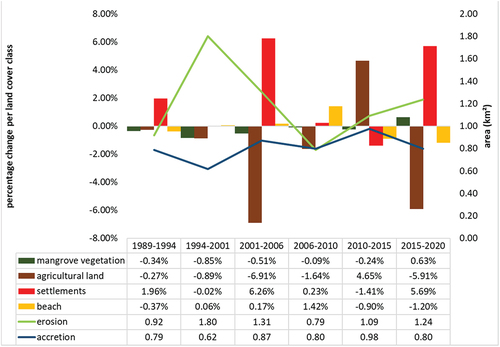
Figure 10. (a) and (b) denuded forests on the coast of Dhulasar; (c) denuded mangrove vegetation on the western coast of Lata Chapli; (d) seawater encroachment into forests near Dhulasar coast.
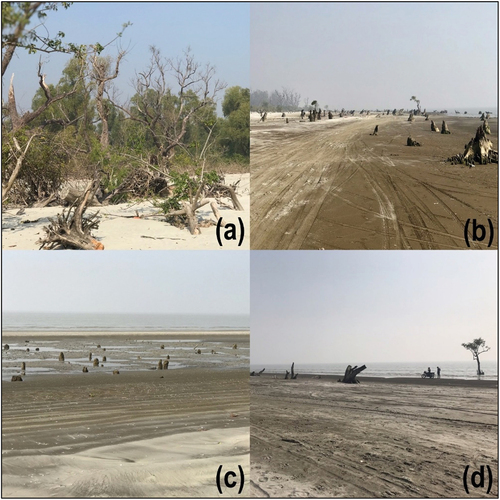
Figure 11. Landcover changes specific to the accretional and erosional zones between 1989 to 2020.
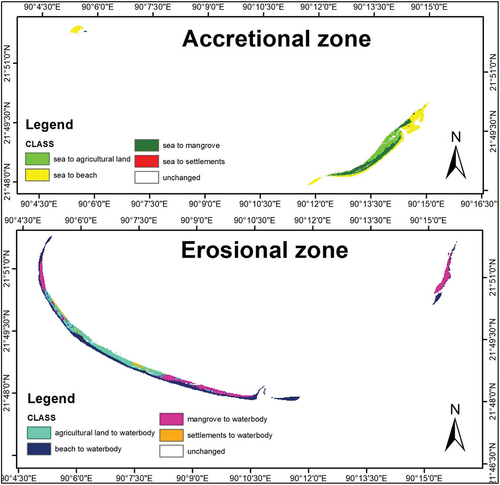
Table A1. Image bands used for the study.
Table B1. Landcover change (km2) matrix.
Table C1. Landsat OLI 2020 confusion matrix.