Figures & data
Figure 1. The map show a location of study area.
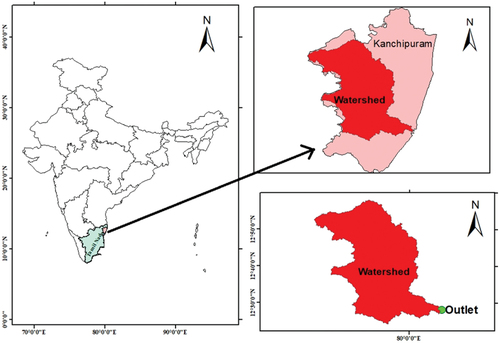
Figure 2. The schematic diagram show the adopted methodologies in the study.
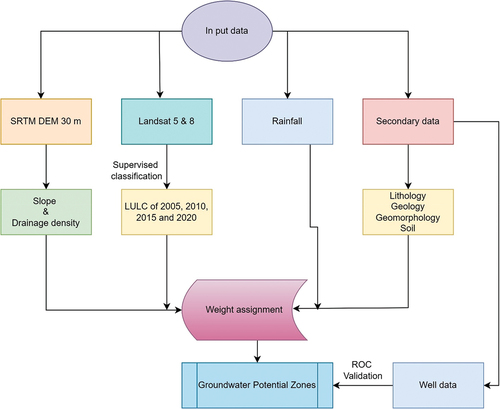
Figure 3. (a) A drainage network map of study area, and (b) A drainage density map of study area (c) The drainage density distribution graph of study area.
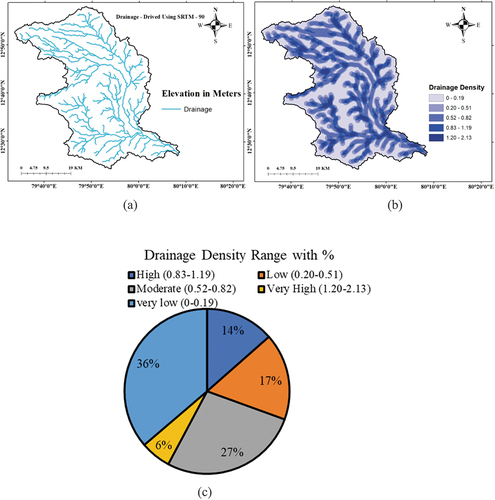
Table 1. Influence and scale value of each feature.
Table 2. Number of wells under different classes during five years intervals.
Figure 4. (a) The geology map for study area, and (b) The geology class distribution graph of study area.
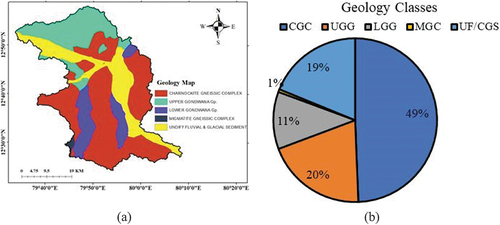
Figure 5. (a) The geomorphology map of study area, and (b) The geomorphology features distribution graph of study area.
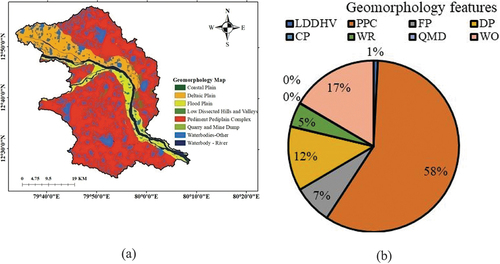
Figure 6. (a) The soil map of study area, and (b) The soil classes distribution graph of study area.
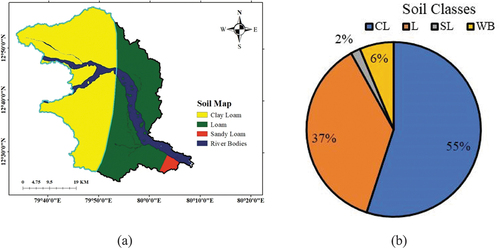
Figure 7. (a) The LULC map of study area of 2005 (b) The LULC distribution (in %) of year 2005 (c) The LULC map of study area of 2010 (d) The LULC distribution (in %) of year 2005 (e) The LULC map of study area of 2015 (f) The LULC distribution (in %) of 2015 (g) The LULC map of study area of 2020, and (h) The LULC distribution (%) of 2020.
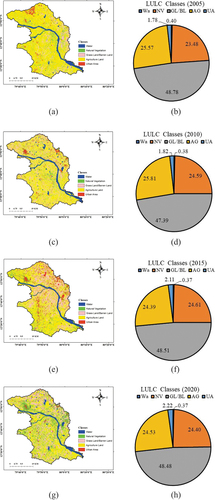
Figure 8. (a) The average annual rainfall distribution of 2005 (b) The average annual rainfall distribution of 2010 (c) The average annual rainfall distribution of 2015, and (d) The average annual rainfall distribution of 2020.
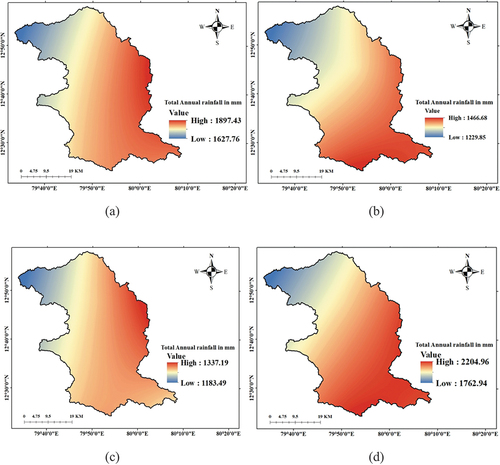
Figure 9. (a) The DEM of study area, and (b) The slope map of study area.
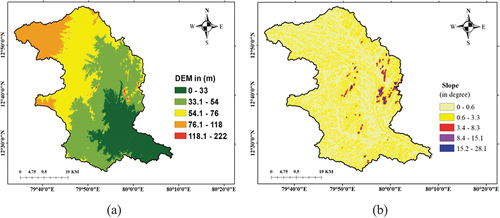
Figure 10. (a) The GWPZ of 2005 (b) The distribution GWPZ 2005 c The GWPZ of 2010 (d) The distribution GWPZ 2010 (e) The GWPZ of 2015 (f) The distribution GWPZ 2015 (g) The GWPZ of 2020, and (h) The distribution GWPZ 2020.
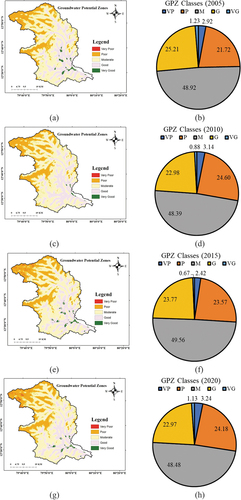
Figure 11. (a) The GWPZ map of 2005 (b) The distribution GWPZ of 2005 (c) The GWPZ map of 2010 (d) The distribution GWPZ of 2010 (e) The GWPZ map of 2015 (f) The distribution of GWPZ in percentage 2015 (g) The GWPZ map of 2020, and (h) The distribution of GWPZ in percentage 2020.
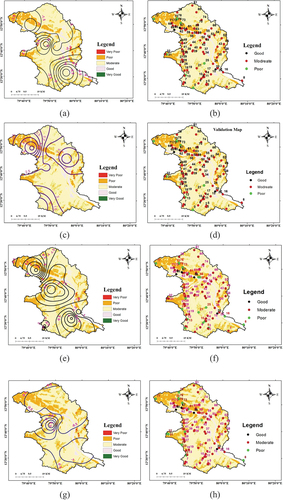
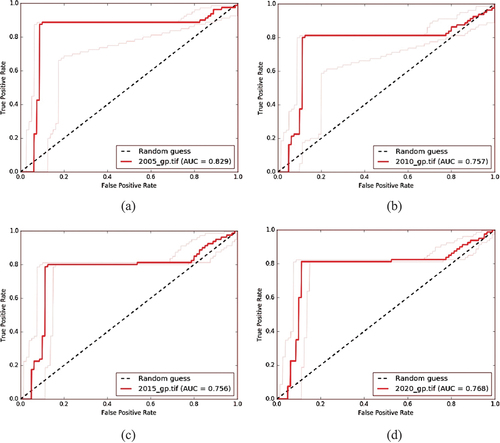
Figure 12. (a) The ROC curve for validation of predicted map 2005 (b) The ROC curve for validation of predicted map 2010 (c) The ROC curve for validation of predicted map 2015, and (d) The ROC curve for validation of predicted map 2020.