
Figures & data
Figure 1. Map of the study area.
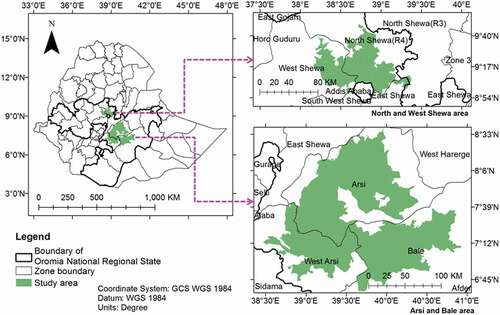
Figure 2. Average long term (1999–2014) NDVI profile of the NDVI classes studied.
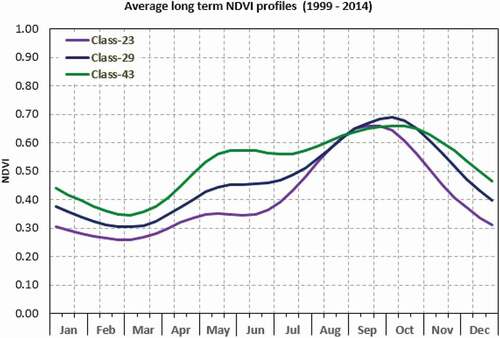
Figure 3. Distribution of sample points from the survey strata in North and West Shewa Zones.
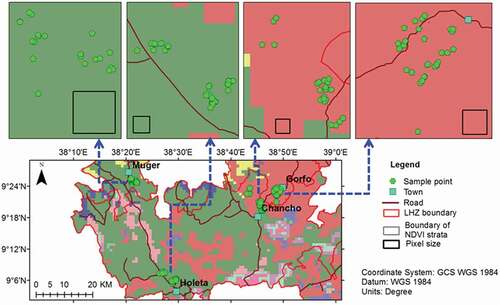
Figure 4. Distribution of sample points from the survey strata in Arsi, West Arsi and Bale Zones.
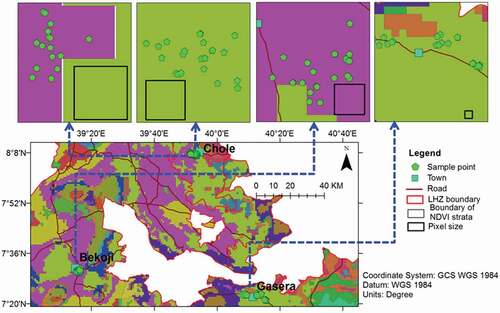
Table 1. Kruskal-Wallis rank sum test between all NDVI classes and LHZs.
Table 2. Mann-Whitney U test between NDVI classes and LHZs.
Figure 5. A NDVI strata-based calendar of the study area for ploughing date using interview data of 2015. The box plot is based on median.
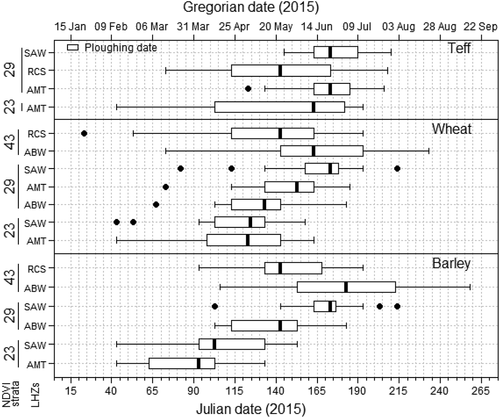
Figure 6. A NDVI strata-based calendar of the study area for planting and expected harvesting dates using interview data of 2015. The box plot is based on median.
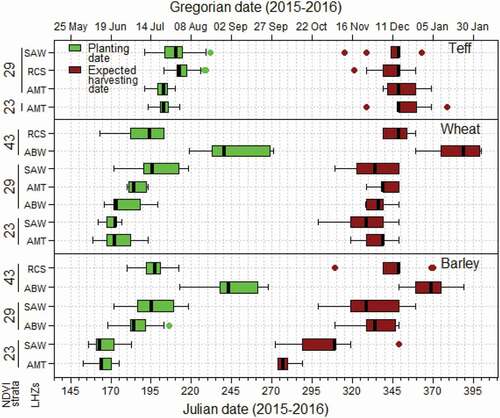
Table 3. Strata homogeneity statistics for NDVI classes and livelihood zones.