Figures & data
Figure 1. Geographic location of the case study in Benue State, Nigeria.
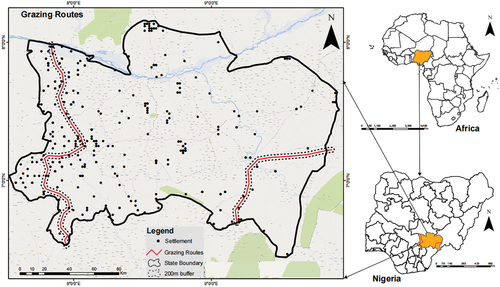
Table 1. Specification of Raster and Vector Datasets.
Figure 2. Methodology flowchart.
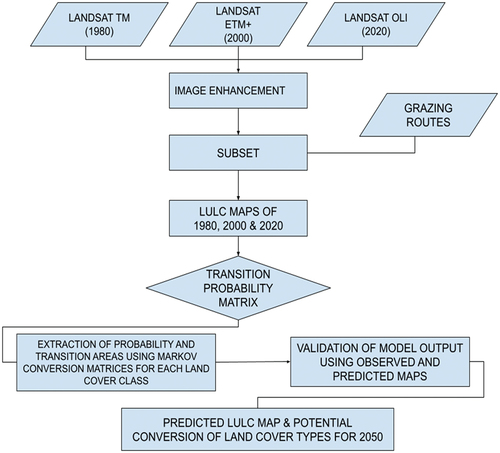
Table 2. Table showing the LULC types and their descriptions.
Figure 3. a LULC on the western side of the grazing route in 1980. b: LULC on the eastern side of the grazing route in 1980. c LULC on the western side of the grazing route in 2000. d LULC on the eastern side of the grazing route in 2000. e: LULC on the western side of the grazing route in 2020. f LULC on the eastern side of the grazing route in 2020.
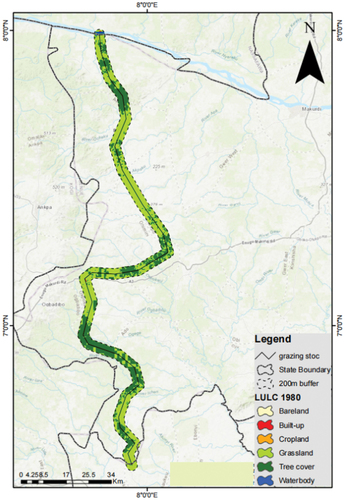
Figure 3. (Continued).
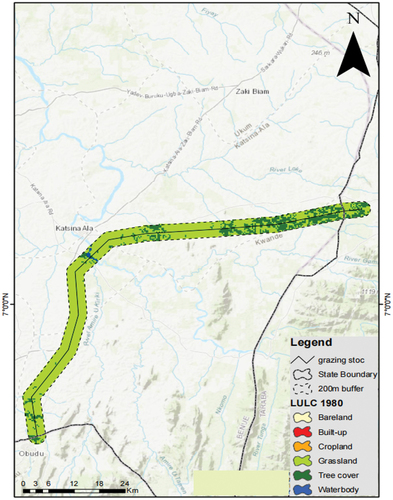
Figure 3. (Continued).
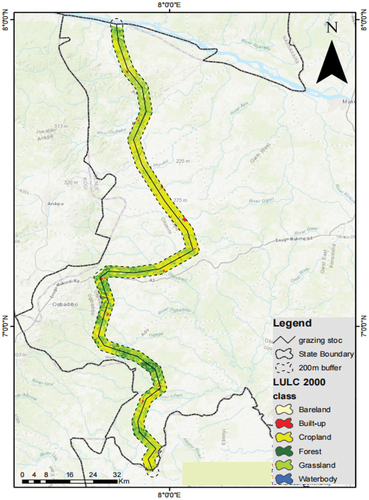
Figure 3. (Continued).
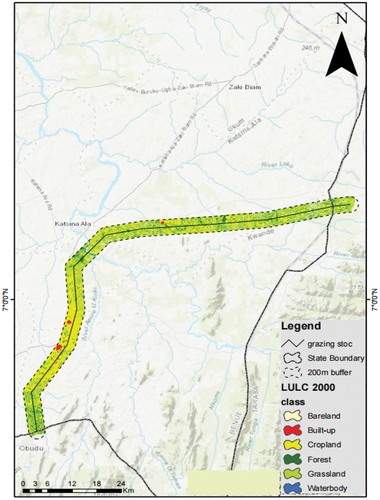
Figure 3. (Continued).
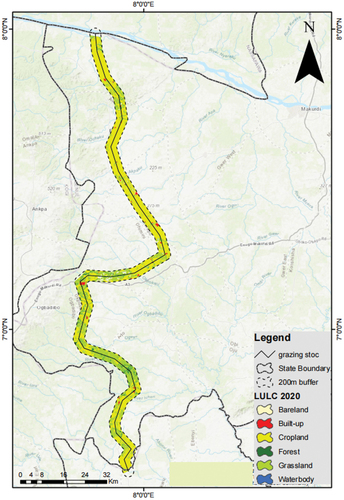
Figure 3. (Continued).
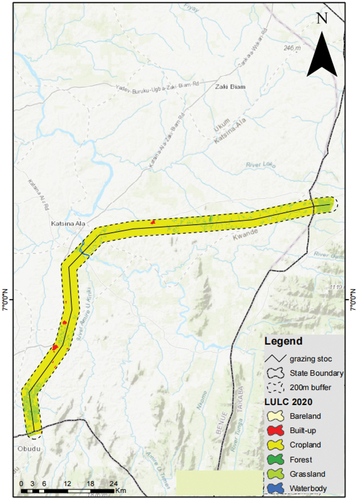
Figure 4. Chart showing the Spatio-temporal Change of the various land cover types.
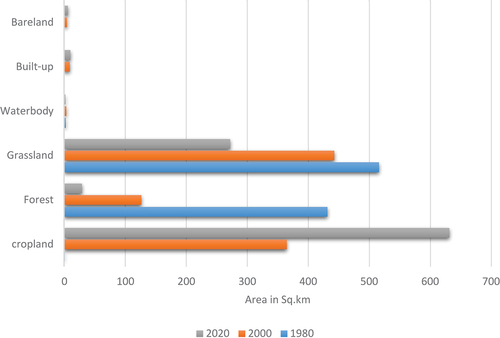
Table 3. LULC coverage along grazing routes of 1980, 2000 and 2020.
Table 4. Accuracy assessment and kappa coefficient.
Figure 5. Chart showing the Rate of Change among the various land cover types.
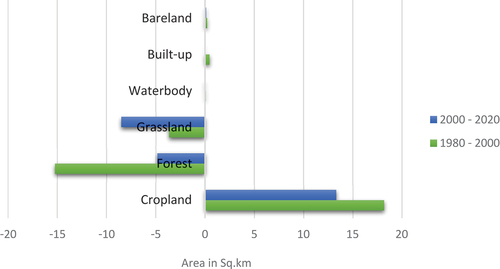
Table 5. Table showing the TPM produced by modeling the period between 2020 and 2050.
Figure 6. The potential conversion of various land cover types by 2050.
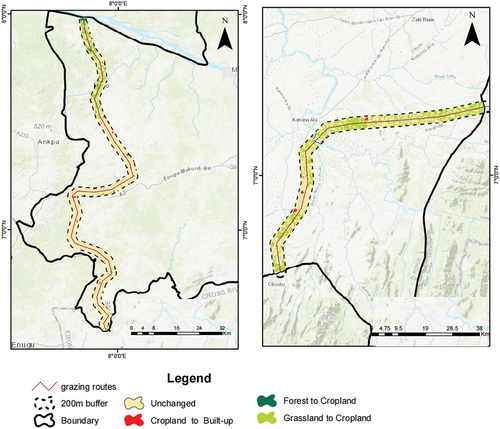
Figure 7. a Projected LULC of the grazing route on the western side in 2050. b Projected LULC of the grazing route on the eastern side in 2050.
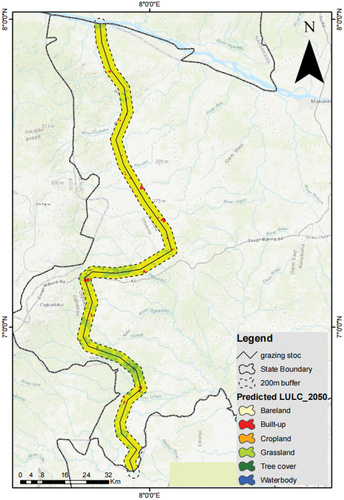
Figure 7. (Continued).
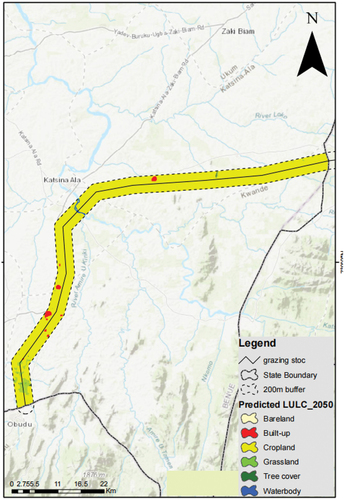
Table 6. Descriptive statistics of LULCs that show the areal extent and Spatio-temporal changes between 2020 and 2050.
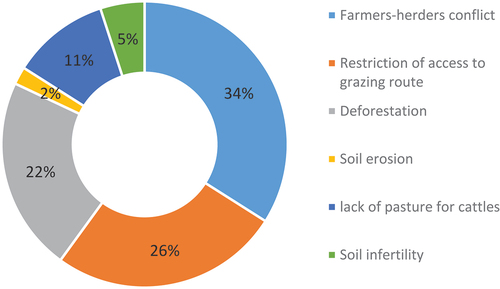
Figure 8. a. Perceived drivers of LU/LC change. b. Perceived impacts of LU/LC change.
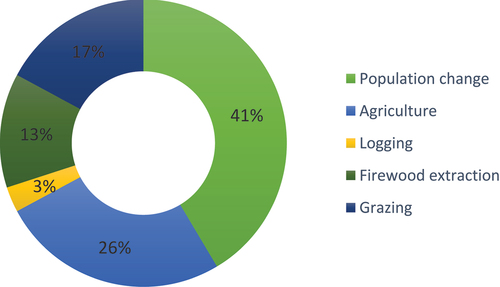
Figure 8. (Continued).