Figures & data
Figure 1. The geographic location of the study area. A) The major watersheds, drainage networks, and fault lines overlay on an elevation map. B) The mouth of Loboc Watershed. C) The midstream agricultural area of Wahig – Inabanga Watershed.
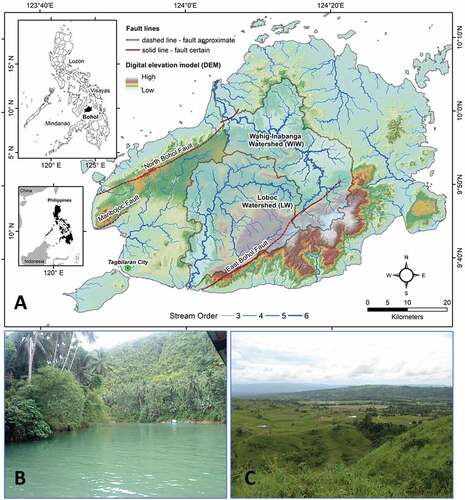
Figure 2. The process flow of morphometric analysis in Bohol watersheds.
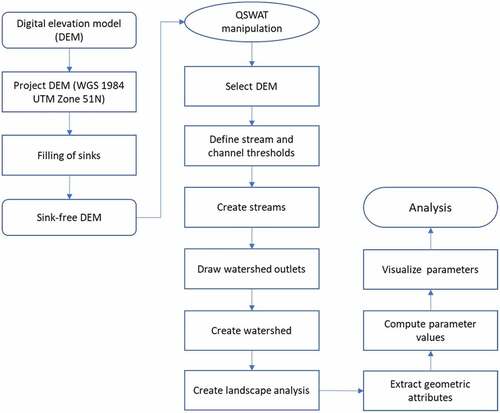
Table 1. List of morphometric parameters used in the study, equations, and the source of information.
Table 2. Stream network characteristics and the linear aspects of LW and WIW.
Figure 3. Drainage network organization and the stream orders in the watersheds under study.
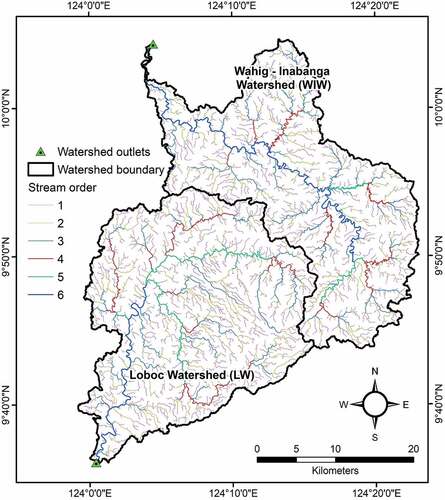
Table 3. Results of the areal aspect analysis in LW and WIW.
Table 4. Relief aspect analysis and the computed values in LW and WIW.
Figure 4. Elevation profile of the LW and WIW main rivers from the headwaters to their outlets. The main trunk’s length and peak elevations are 89 km and 732 m, and 105 km and 869 m for LW and WIW, respectively.
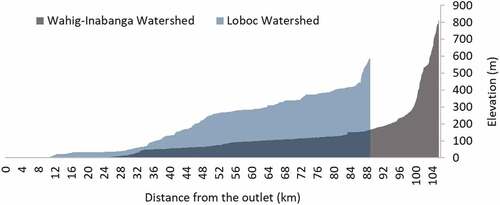
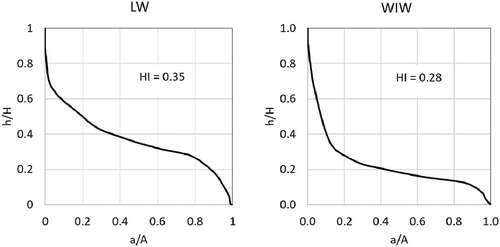
Figure 5. Hypsometric curve and hypsometric integral (HI) of the watersheds under study.