Figures & data
Figure 1. Study area (Source: http://srtm.csi.cgiar.org) and locations of seven studied altitude transects in alpine regions of Uttarakhand.
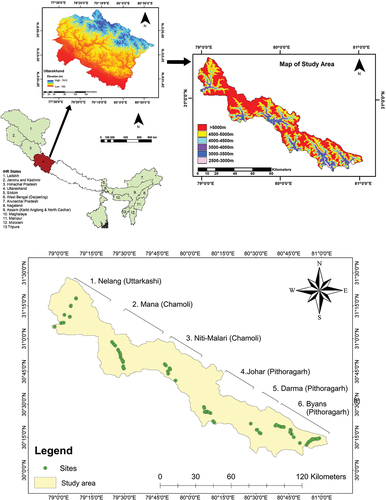
Table 1. Floristic diversity pool (S- Species, G- Genus, F- Family) in high-altitude alpine region of Uttarakhand along altitude gradient.
Table 2. Beta diversity variations across life forms and transects.
Figure 2. Species richness, diversity and density trends along altitude gradients in different life forms [A] Trees, [B] Shrubs, [C] Herbs in alpine of Uttarakhand, west Himalaya.
![Figure 2. Species richness, diversity and density trends along altitude gradients in different life forms [A] Trees, [B] Shrubs, [C] Herbs in alpine of Uttarakhand, west Himalaya.](/cms/asset/2e1f8005-295a-4f30-88d7-ca70e0d7bc81/tgel_a_2163606_f0002_b.gif)
Figure 3. Hierarchical cluster dendrogram showing distinct altitudinal zones with respect to the species composition in alpine region of Uttarakhand, west Himalaya.
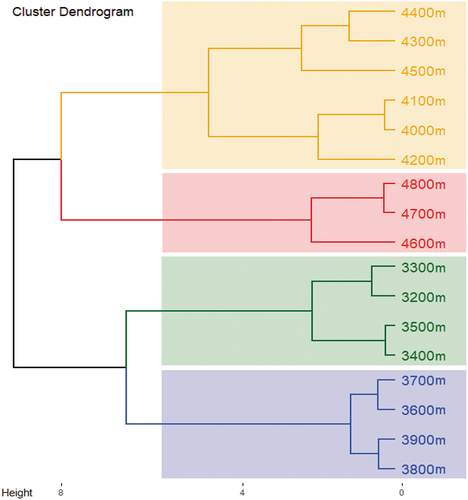
Table 3. Dominant and co-dominant taxa along altitude gradient in studied alpine regions of Uttarakhand, west Himalaya.
Figure 4. Non-metric Multi-Dimensional Scaling (NMDS) representing species composition among sample plots along altitude gradients of study transect.
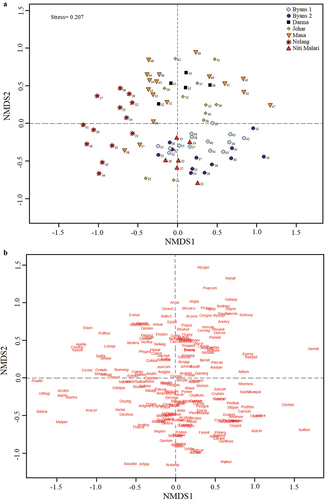
Figure 5. Pearson’s Correlation between plant richness, density and diversity indices with climate variables.
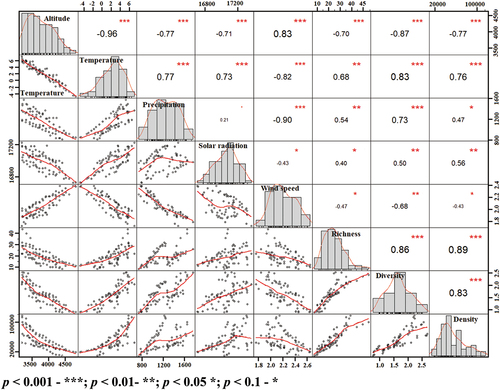
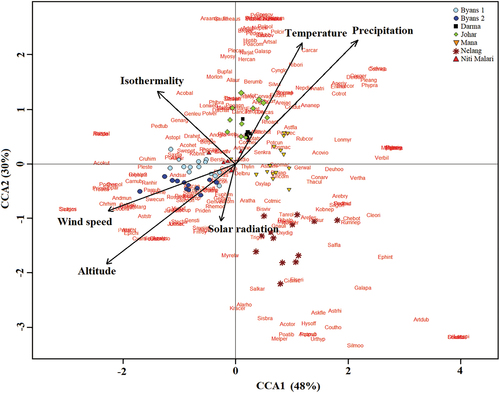
Figure 6. Canonical Correspondence Analysis of combined data set: ordination of sample pots and vegetation abundance constrained by their relationships to environmental variables. Significant parameters are shown as biplot vector.