Figures & data
Figure 1. Location of the study area and sample plots inside.
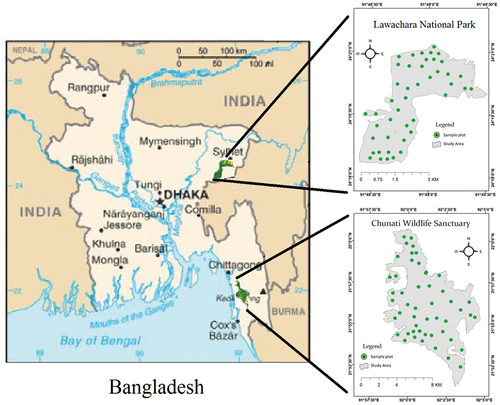
Figure 2. Land-use scenario of CWS and LNP in 1998, 2008 and 2018.
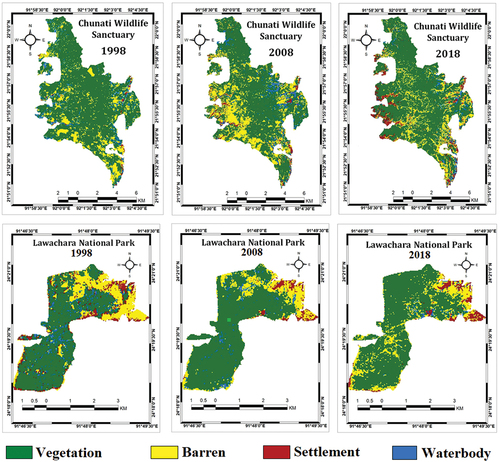
Figure 3. LUC scenario of CWS and LNP including the forecast for next two decades.
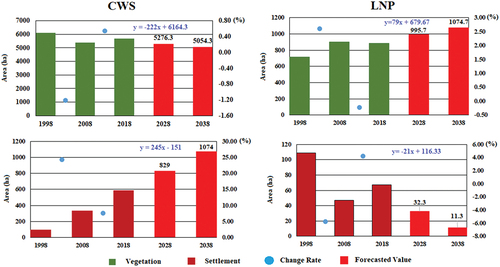
Table 1. Rate of change in land-use classes from 1998 to 2018.
Figure 4. Rare fraction curves for biodiversity composition in CWS and LNP.
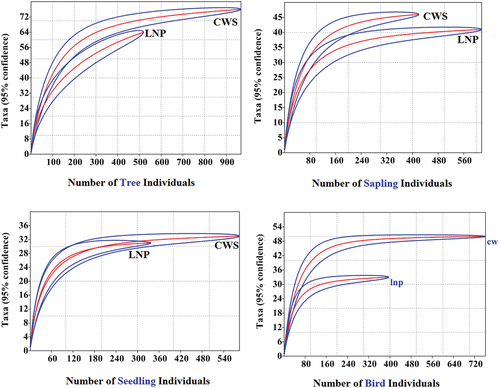
Table 2. Biodiversity composition of plant and bird species in CWS and LNP in Bangladesh.
Table 3. Biodiversity indices of plants and birds in CWS and LNP in Bangladesh.
Figure 5. Rank abundance curves for plant and bird community in CWS and LNP.
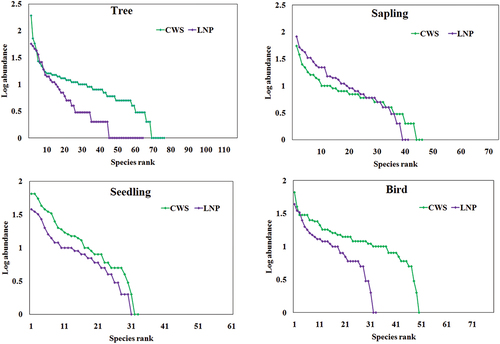
Figure 6. Canonical correspondence analysis of a primary matrix of plant species traits with a second matrix of four environmental variables (CC- canopy coverage, CH- canopy height, EL- elevation, and DS- Disturbance score).
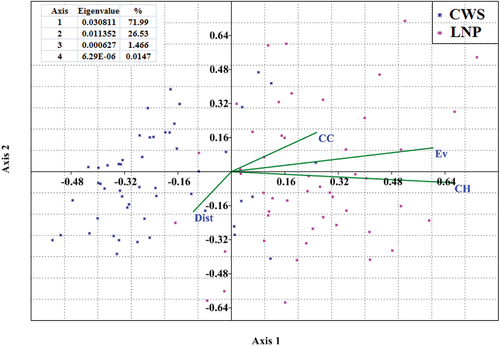
Table 4. Features of micro-habitat environmental variables in the studied areas.
Figure 7. Canonical correspondence analysis of a primary matrix of bird species abundance with a second matrix of six correlated habitat variables (CH- Canopy height, SeAvHt- Seedling average height, EV- Elevation, TrSppRich-Tree species richness, TrAvHt- Tree average height, TrAbun- Tree abundance).
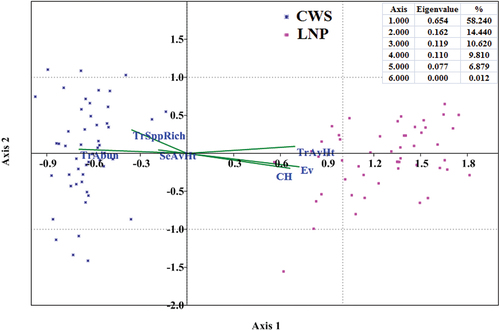
Figure 8. Pattern of forest cover changes found in other studies.
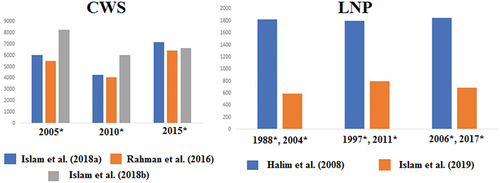
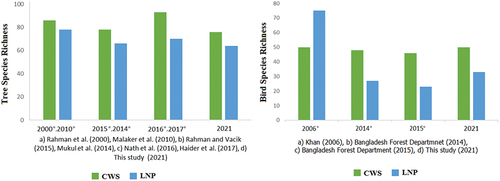
Figure 9. Tree and Bird species diversity changes scenario from 2000 to 2019 in the two protected areas.