
Figures & data
Figure 1. Layout of the study area.
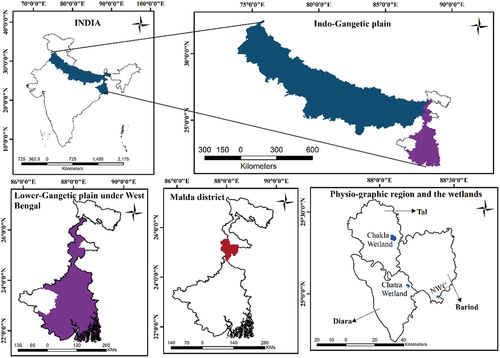
Figure 2. Methodological flowchart adopted for LULC mapping.
Table 1. LULC classification scheme.
Table 2. Satellite data used in the study.
Table 3. Error matrix and total accuracy (Chakla wetland).
Table 4. Error matrix and total accuracy (Chatra wetland).
Table 5. Error matrix and total accuracy (Nayabandh wetland complex).
Figure 3. Sampling sites of the selected wetlands.
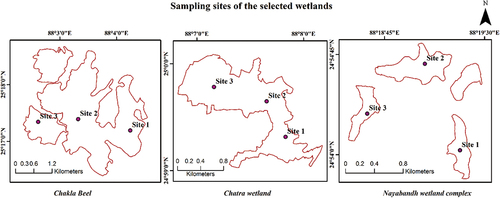
Figure 4. Methodological flowchart adopted for the water quality assessment.
Figure 5. Land use land cover of Chakla Beel in 2003 and 2018.
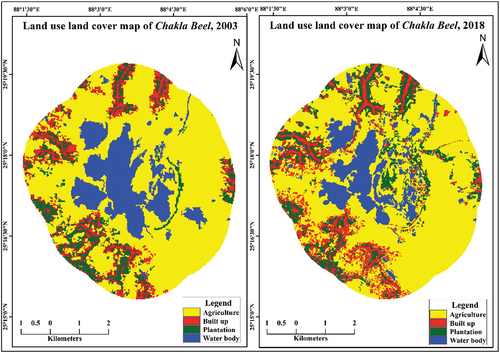
Table 6. Area under different classes in 2003 and 2018 (Chakla wetland).
Figure 6. Change detection map of Chakla Beel (2003–2018).
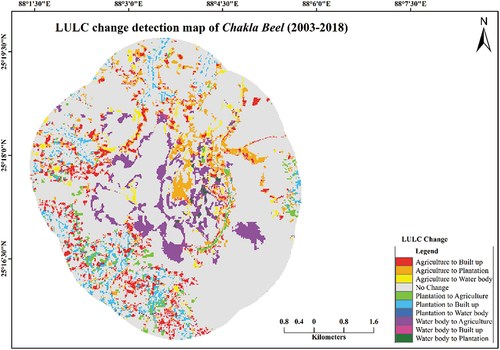
Table 7. Transformation matrix of Chakla wetland.
Figure 7. Land use land cover of Chatra wetland in 2003 and 2018.
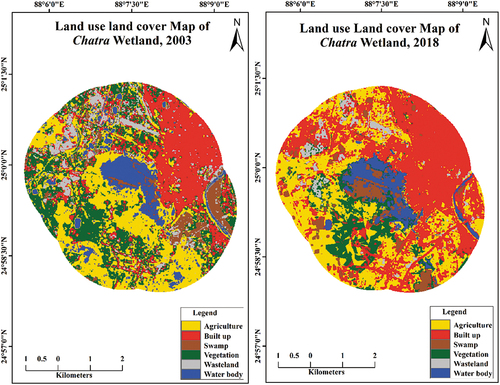
Table 8. Area under different classes in 2003 and 2018 (Chatra wetland).
Figure 8. Change detection map of Chatra Wetland (2003–2018).
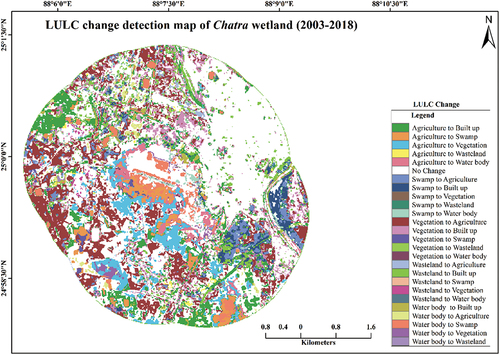
Table 9. Transformation matrix of Chatra wetland.
Figure 9. Land use land cover of Nayabandh wetland complex in 2003 and 2018.
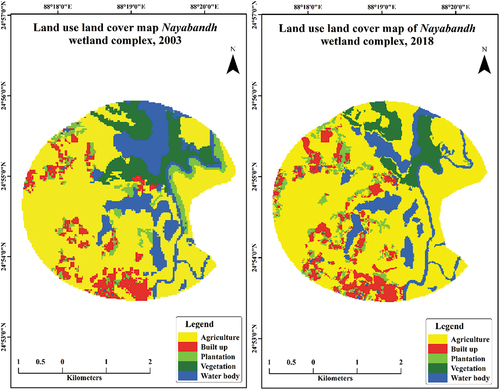
Table 10. Area under different classes in 2003 and 2018 (Nayabandh wetland complex).
Figure 10. Change detection map of Nayabandh wetland complex (2003–2018).
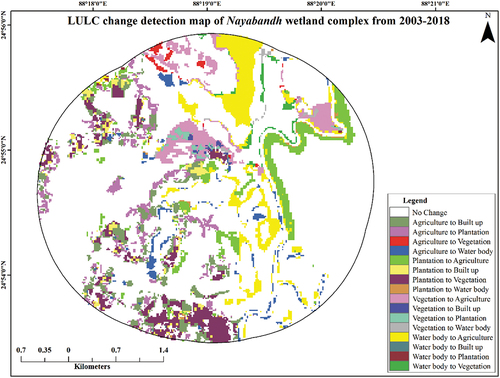
Table 11. Transformation matrix of Nayabandh wetland complex.
Figure 11. (A1 to k2): Spatial variation of water quality parameters of Chakla Beel during pre- and post-monsoon. 1= pre-monsoon, 2= post-monsoon, a-Depth, b- Temperature, c- pH, d- Electrical conductivity, e-TDS, f- Total Hardness, g- Hardness (ca), h- Harness (mg), i- Total Alkalinity, j- Turbidity, k- Chloride.
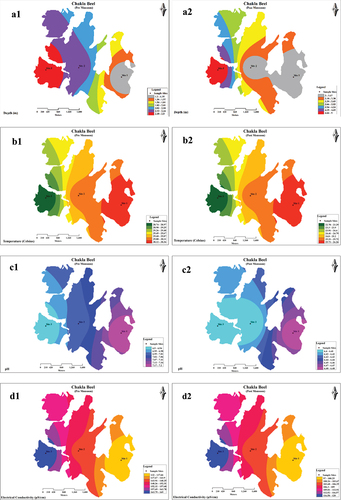
Figure 11. (Continued).
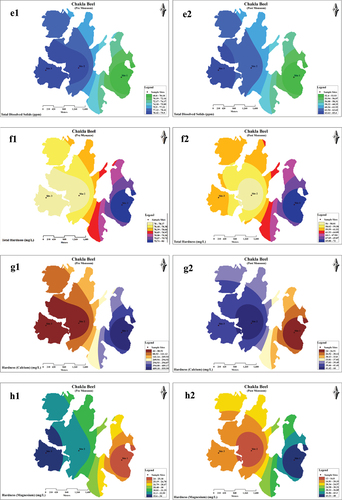
Figure 11. (Continued).
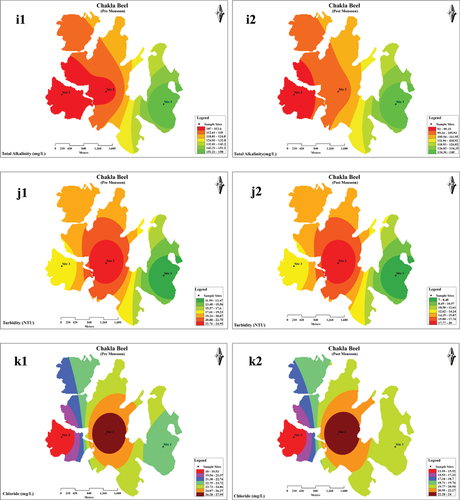
Table 12. Standard limit and assign weights.
Table 13. Physico-chemical concentration values of water quality parameters at selected sites of the wetlands.
Figure 12. (A1 to k2): Spatial variation of water quality parameters of Chatra Wetland during pre- and post-monsoon. 1= pre-monsoon, 2 = post-monsoon, a – depth, b – temperature, c – pH, d – electrical conductivity, e-TDS, f – total Hardness, g – hardness (ca), h – harness (mg), i – total alkalinity, j – turbidity, k - chloride.
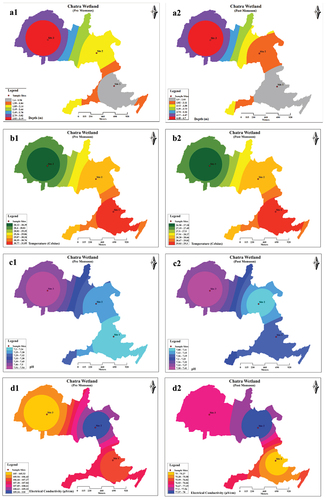
Figure 12. (Continued).
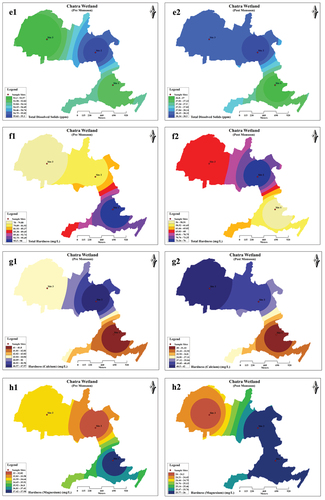
Figure 12. (Continued).
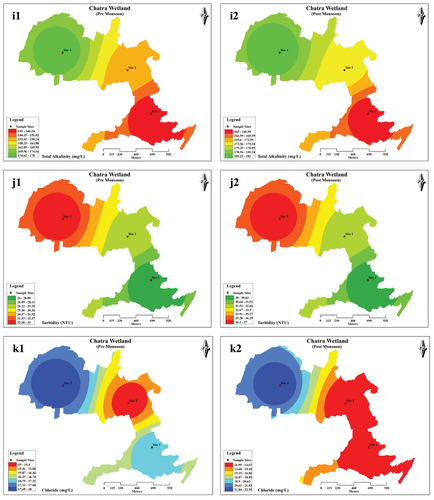
Figure 13. (A1 to k2): Spatial variation of water quality parameters of Nayabandh wetland complex during pre- and post-monsoon. 1= pre-monsoon, 2= post-monsoon, a Depth, b – Temperature, c – pH, d – electrical conductivity, e – TDS, f – total hardness, g – hardness (ca), h- – harness (mg), i – total alkalinity, j – t urbidity, k – chloride.
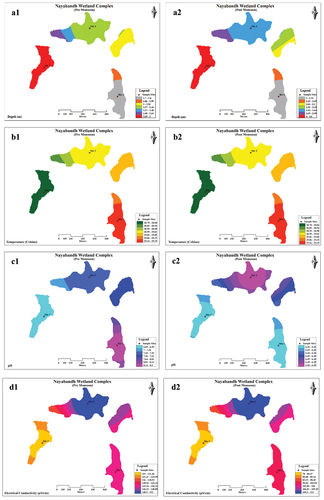
Figure 13. (Continued).
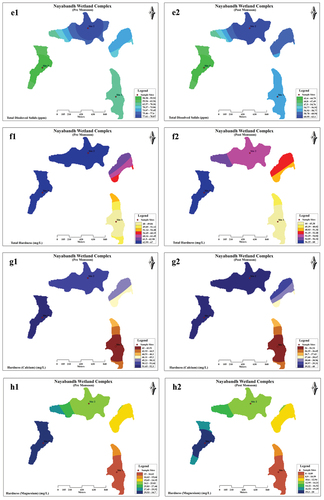
Figure 13. (Continued).
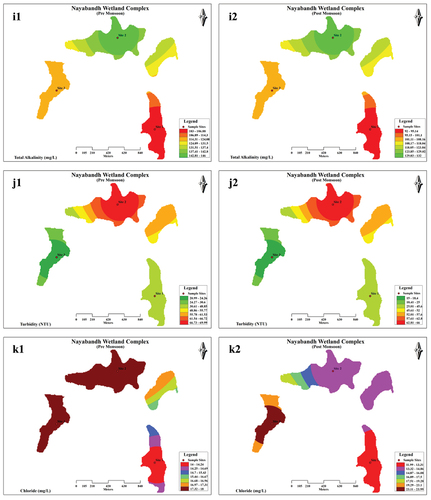
Table 14. Water Quality Index (WQI) of selected sites of the wetlands.
Figure 14. Water quality index of Chakla Beel.
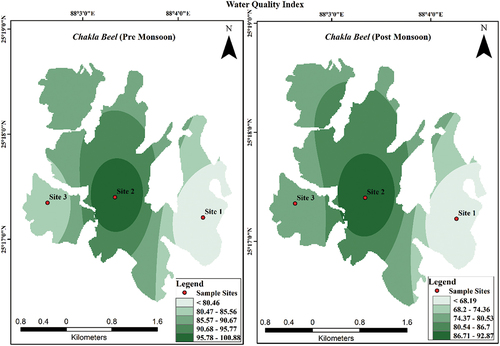
Figure 15. Water quality index of Chatra wetland.
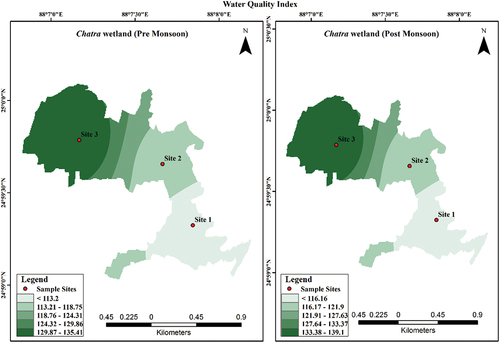
Figure 16. Water quality index of Nayabandh wetland complex.
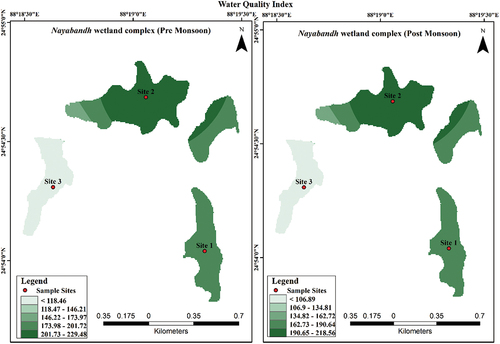
Table 15. Water Quality status of selected sites of the wetlands.