Figures & data
Figure 1. Location map of Maybar watershed.
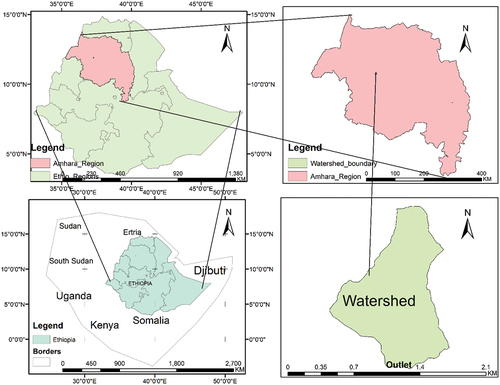
Figure 2. Soil types of the Maybar watershed.
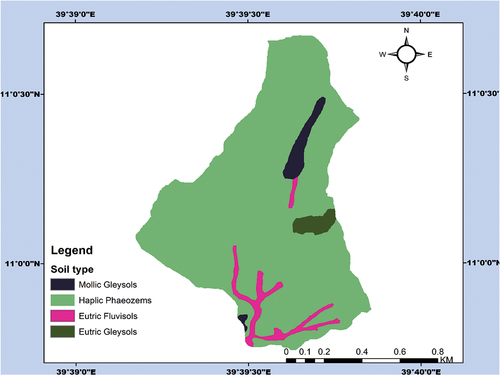
Figure 3. Mean annual rainfall and maximum/minimum/mean temperatures for the study area.
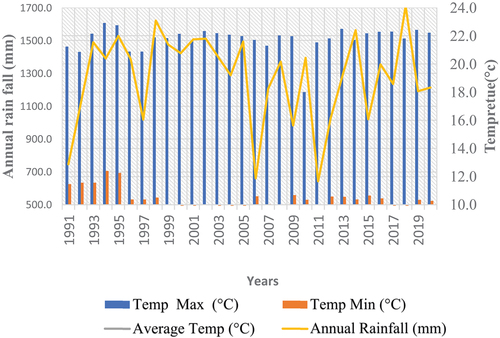
Figure 4. Mean monthly rainfall and maximum/minimum/mean temperatures for the study.
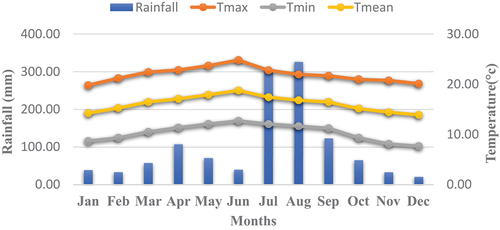
Table 1. Data used and source.
Table 2. Land use Description of the study area (Tesfaye et al. Citation2017).
Table 3. C-factor value based on Hurni (Citation1985) and Nigussie et al. (Citation2017).
Figure 5. Slope class of the study area.
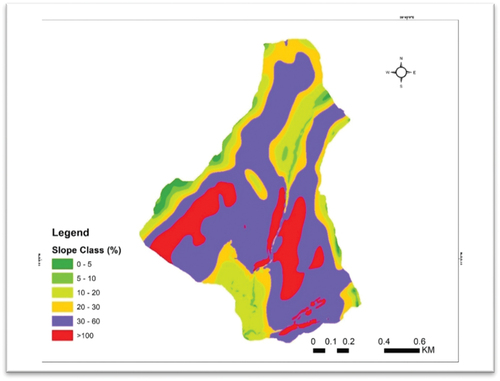
Figure 6. Flow chart of the analysis.
Table 4. Land use type in Maybar watershed for 2004, 2012, and 2020.
Figure 7. Land use and land cover of the study area (2004).
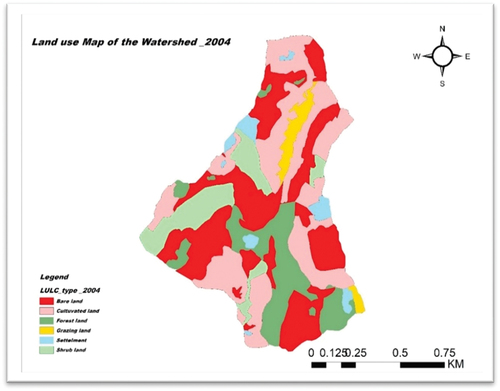
Figure 8. Land use and land cover of the study area (2012).
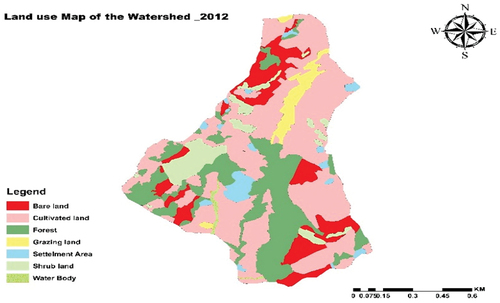
Figure 9. Land use and land cover of the study area (2020).
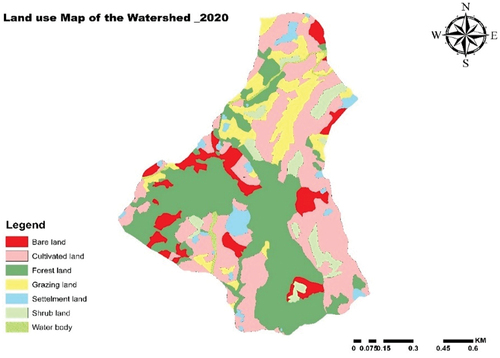
Table 5. Trend of LULC 2004 – 2020.
Table 6. Mean annual rainfall and erosivity factor of the study area.
Figure 10. Soil sample distribution (left) and soil erodibility (K) factor map (right).
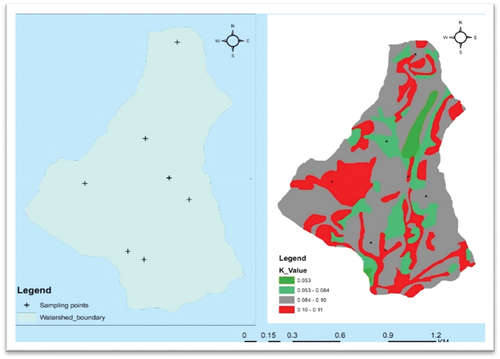
Table 7. Statistically summary of soil parameters in the watershed.
Table 8. Soil type and corresponding erodibility factor of the watershed.
Figure 11. Slope in degree (left) and ls _factor value (right).
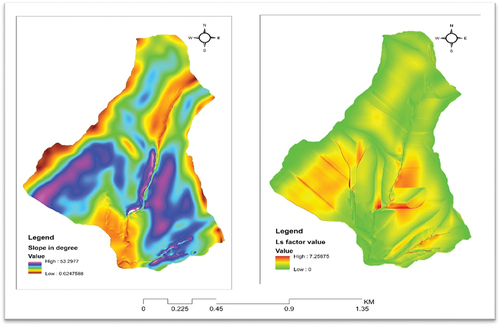
Table 9. Estimated soil loss with slope gradient in 2004 and 2020.
Figure 12. Cover management factor (C-Value) for the three study years.
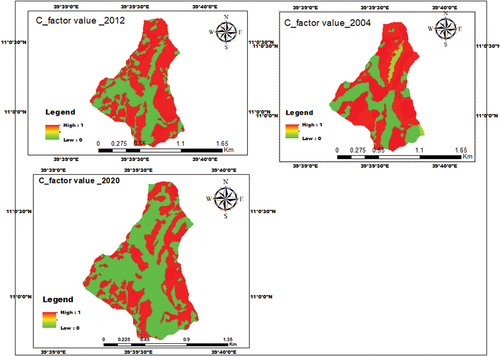
Figure 13. P _factor map for Maybar watershed for the years 2004,2012 and 2020.
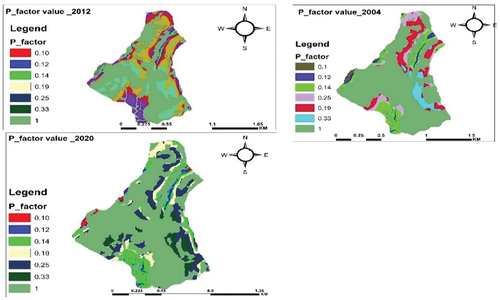
Table 10. Support practices (P) factor based on (Wischmeier and Smith Citation1978a).
Figure 14. Annual soil loss map in 2004, 2012 and 2020 of the watersheds.
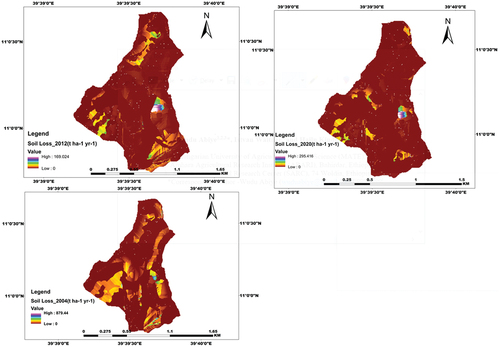
Table 11. Temporal variation of soil erosion with land use dynamics.
Table 12. Distribution of annual and mean soil loss between different types of land use during (2004, 2012, and 2020).
Figure 15. Variation in mean soil loss in different land use classes and years.
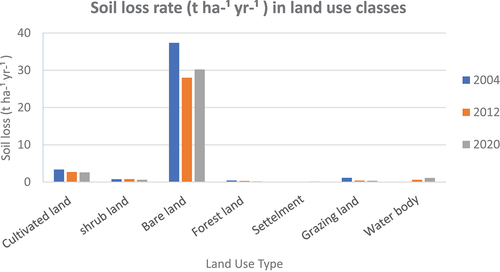
Table 13. Soil erosion across different soil types during 2004, 2012, and 2020.
Table 14. Soil erosion classification based on Morgan (Citation2005a).
Figure 16. Soil erosion severity map.
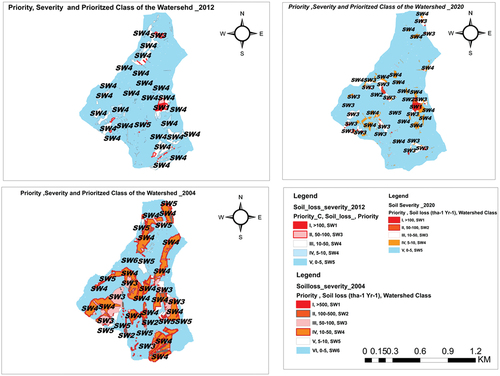
Table 15. Prioritized part of watersheds for conservation planning purposes.
Figure 17. Annual soil loss and severity class map of the Maybar watershed.
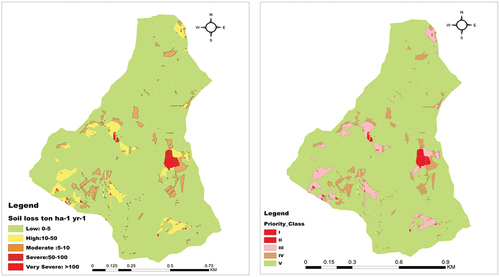
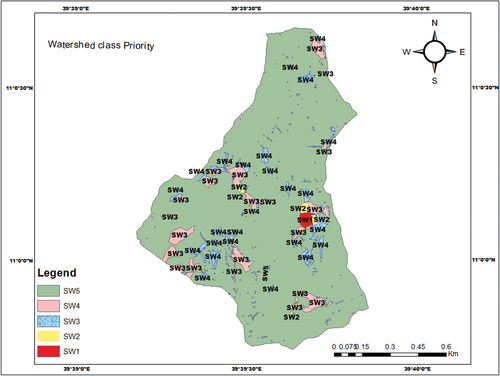
Figure 18. Current priority class of the watershed for soil and water conservation.