Figures & data
Figure 1. Map showing location of co-managed and non-co-managed forest areas.
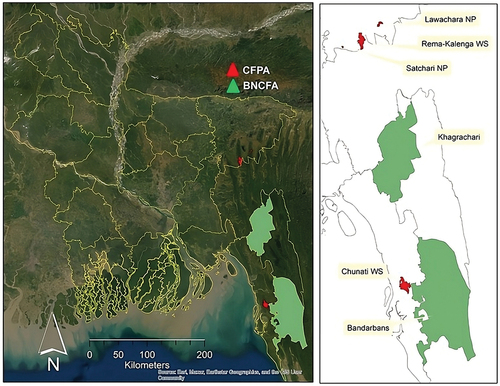
Table 1. A brief summary of the study areas.
Table 2. A list of ecosystem functions, indicators, and MODIS products.
Figure 2. Method of data extraction and analysis.
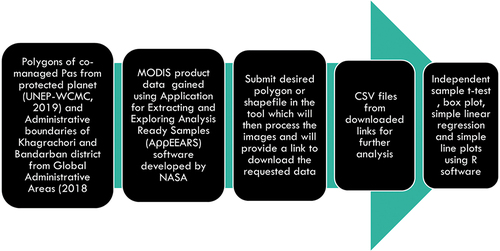
Figure 3. Differences in ecosystem functions under CFPA and BNCFA. t-test has been conducted to see the differences between CFPA and BNCFA.
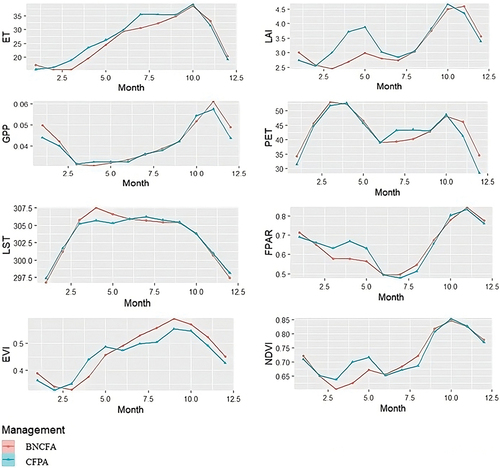
Figure 4. Seasonal variations of differences in ecosystem functions under CFPA and BNCFA. t-test has been conducted to see the differences between CFPA and BNCFA.
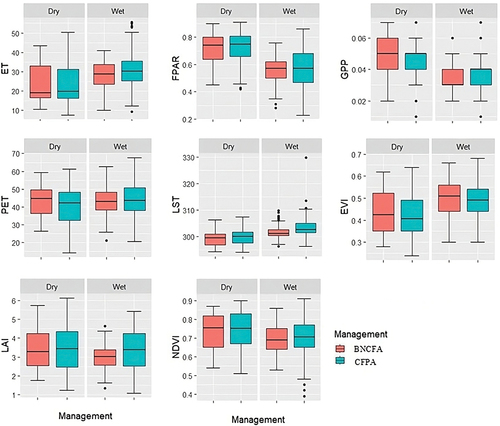
Figure 5a. Influence of vegetation on water, temperature, and ecosystem productivity regulation under different forest management regimes. Diagnostic plots of regression are available in supplementary material 1. Among three R2 values, two values corresponds to BNCFA and CFPA, and another R2 value represents combined datasets of BNCFA and CFPA.
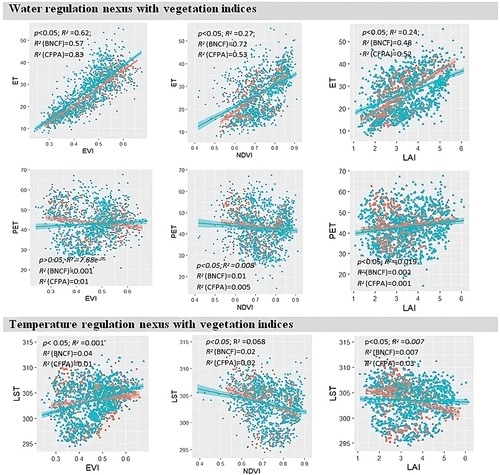
Figure 5b. (Continued).
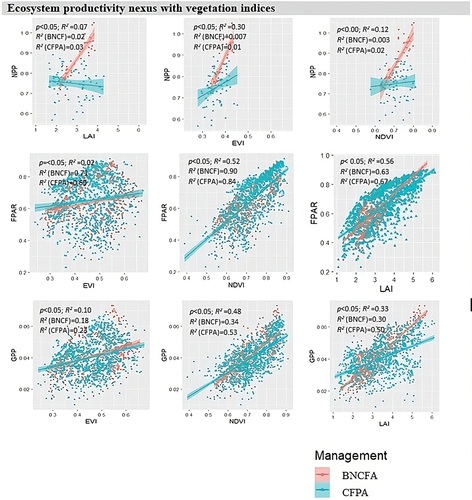
Table 3. Pearson correlation of ecosystem function parameters in CFPA in dry season.
Table 4. Pearson correlation of ecosystem function parameters in CFPA in wet season.
Table 5. Pearson correlation of ecosystem function parameters in BNCFA in dry season.
Table 6. Pearson correlation of ecosystem function parameters in BNCFA in wet season.
Figure 6. Temporal changes in ecosystem functions.
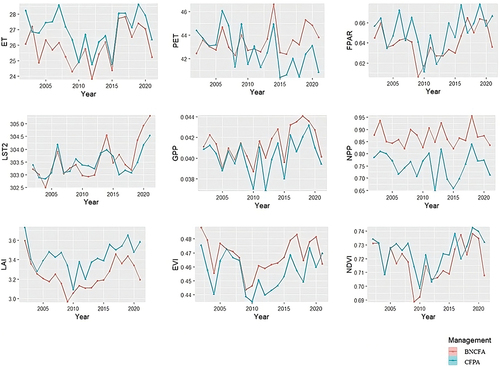
Figure 7. Monthly variation of ecosystem functions.