Figures & data
Figure 1. Study area and survey points of districts Lodhran, Vehari and Multan.
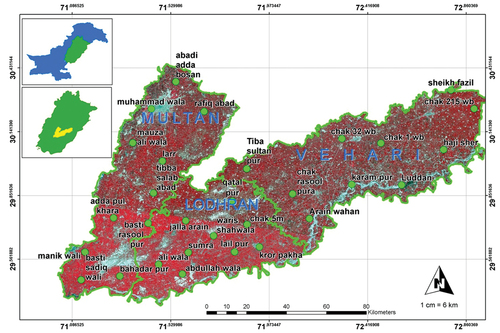
Table 1. LULC classification pattern [64].
Table 2. Details of Landsat images with their specification.
Figure 2. Details of classification and methodological steps.
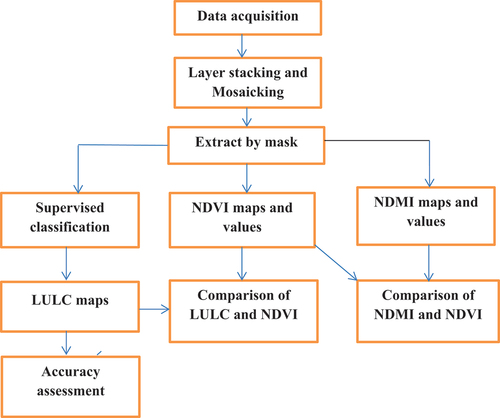
Figure 3. The LULC maps of study area for (1) = 2000 (2) = 2007 (3) = 2014 (4) = 2021.
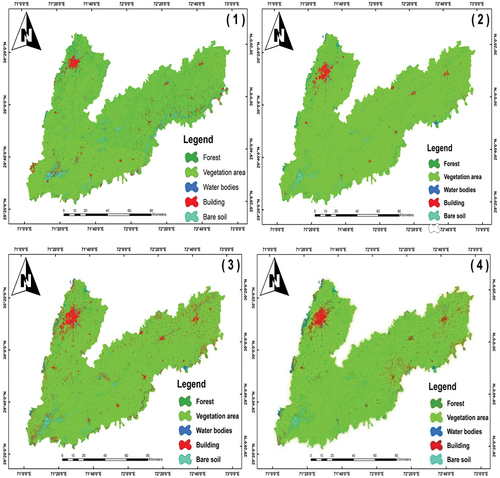
Figure 4. Area calculation of various LULC classes during 2000 to 2021.
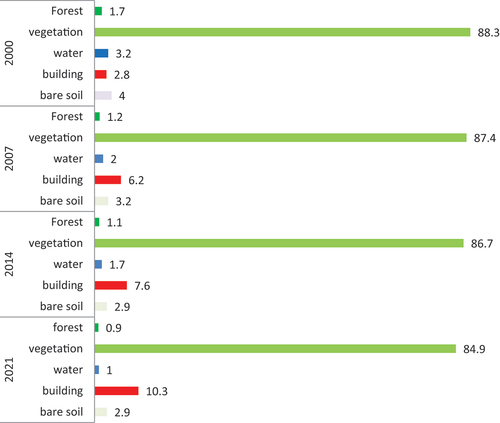
Table 3. LULC changes 2000 to 2021 of the study area.
Table 4. Details of producer’s and user’s accuracy for various classes.
Table 5. Summary of (kappa coefficients) as well as average accuracies.
Figure 5. The NDVI maps of study area for (1) = 2000 (2) = 2007 (3) = 2014 (4) = 2021.
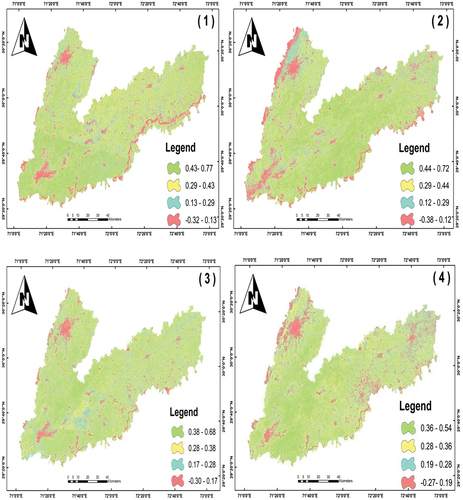
Table 6. Minimum and maximum values of NDVI and NDMI of the study area.
Figure 6. The NDMI maps of study area for (1) = 2000 (2) = 2007 (3) = 2014 (4) = 2021.
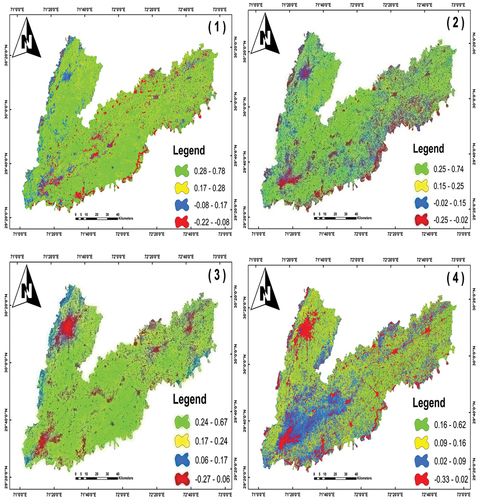
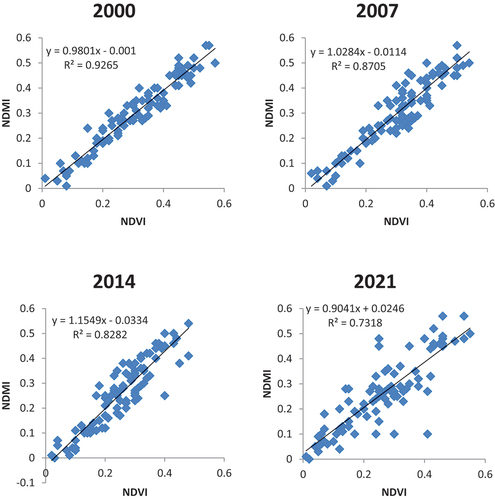
Figure 7. Relationship between NDVI and NDMI in the study area.