
Figures & data

Figure 1. Cratons and Pan African mobile belts in Africa (Modified after Powell et al., Citation1990; Unrug, Citation1997). DM – Damara, GP – Gariep, LF – Lufillian Fold Belt, MA – Mauretanides, NS – Nubian Shield, MB – Mozambique Belt, RB – Rokelides Belt, SD – Saldania, WC – West Congo Belt, ZB – Zambezi Belt.
Figure 2. (a) Index map showing the location of Nigeria (bound by a red polygon) and neighbouring countries (b) Generalized geological map of Nigeria (modified after Adelana et al., Citation2008; Wright, Citation1985) showing the major lithostructural units including the Neoproterozoic Schist Belts. 1 – Iseyin-Oyan; 2 – Ilesha; 3 – Igarra; 4 – Egbe Isanlu; 5 – Zungeru - Birnin Gwari; 6 – Kushaka; 7 – Zuru; 8 – Anka; 9 –Maru; 10 – Wonaka; 11– Karaukarau. IF – Ifewara Fault, AF – Anka, Fault, KF – Kalangai Fault. The study is area bounded by a black rectangle.
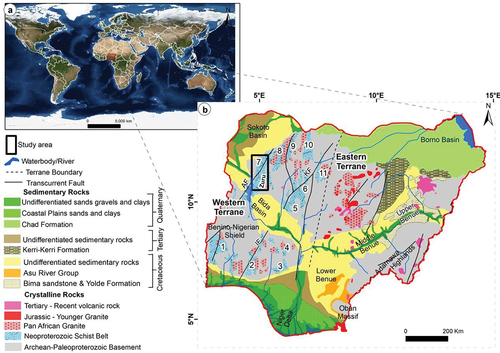
Figure 3. (a) Shaded relief model of the Zuru Schist Belt (b) Geological map of the study area modified after Nigerian Geological Survey Agency (NGSA) (2006). AF – Anka Fault. Non-mineralized locations are randomly generated points used for comparative analysis with known gold occurrences in point pattern and distance distribution analysis. Major structures are derived from interpretation of a shaded relief model generated from SRTM data (Fagbohun et al., Citation2020b).
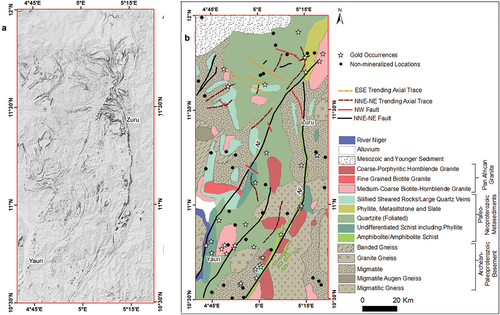
Figure 4. Pictures showing trenches and pits within foliated hosted rock and pile of fragments of mineralized quartz veins extracted from these trenches and pits at a location where mining is active.
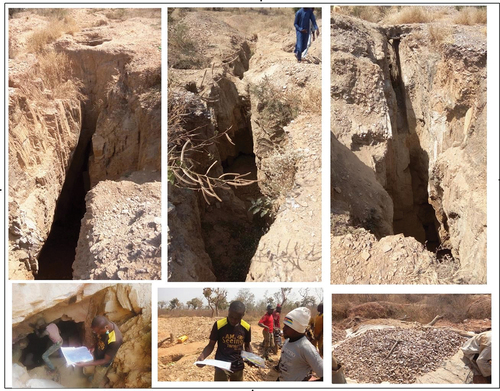
Table 1. Table showing the means of 1st to 7th order neighbour distances of known gold occurrences and random non-mineralized locations in Zuru Schist Belt.
Figure 5. Log-log plot of n(δ) versus δ, the two fitted lines indicates two distinct spatial patterns.
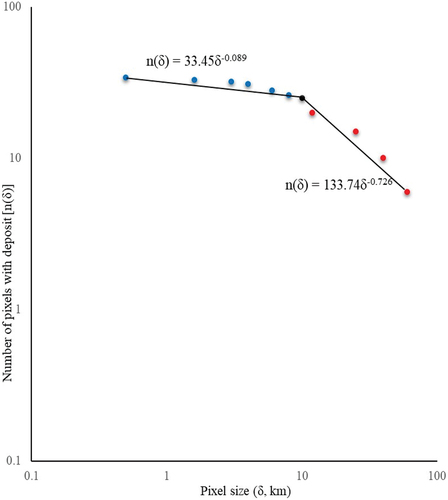
Figure 6. Log-log plots of distances from location known gold occurrence against the densities of known occurrences.
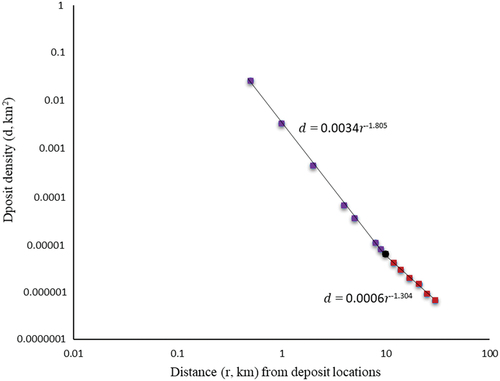
Figure 7. (a) Fry plot of gold occurrences in the study area. (b) Rose diagram of orientations of all pairs of translated points (c) Rose diagram of orientations of pairs of translated points within 8 km distance to each other (d) Rose diagram of orientations of pairs of translated points within 3 km distance to each other.
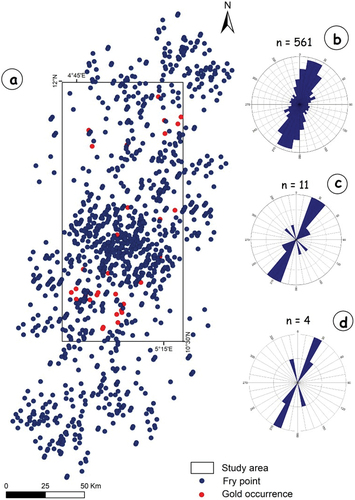
Figure 8. Plots showing cumulative distances from known gold occurrences, as well as from non-mineralized locations to: (a) NE-striking faults (b) NW-striking fault, (c) N-S trending axial trace and (d) ESE trending axial trace.
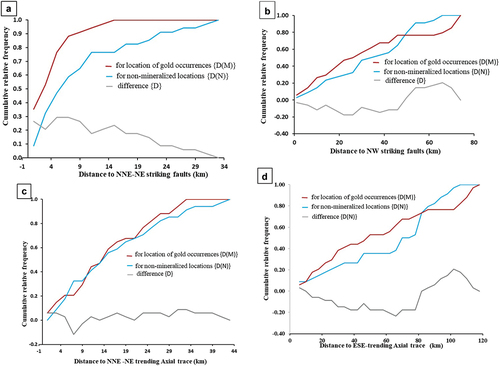
Figure 9. Graphical representation of the relationship between structures of different orientations and known gold occurrences based on distance distribution analysis in .
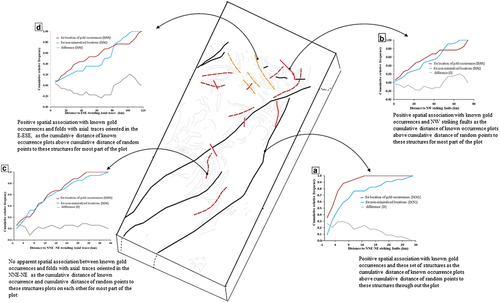
Table A1. Details of known gold occurrences.