
Figures & data
Figure 1. The Eastern Ligurian Sea study area was divided into four sub-areas: A, Capo Arenzano–Punta Chiappa; B, Punta Chiappa–Punta Mesco; C, Punta Mesco–Punta Bianca; D, Punta Bianca–northern Elba Island.
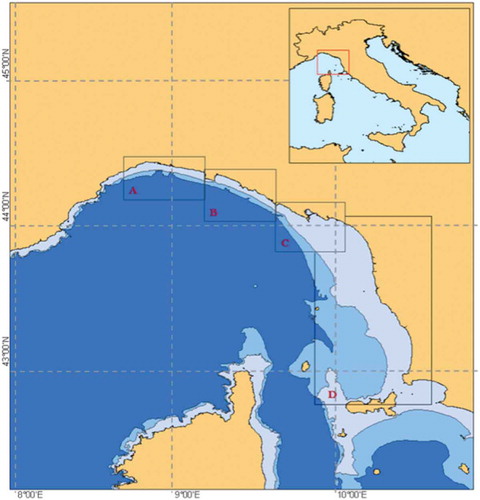
Figure 2. Mother–calf association (Photo credit: Alessia Rossi).
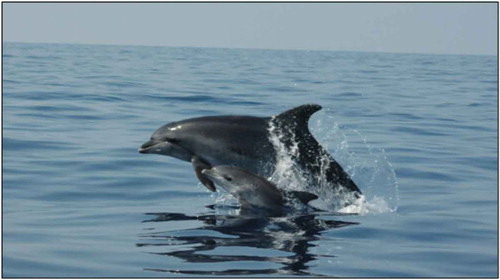
Table I. Column 1 (from left): the surveyed sub-areas; column 2: observed number of sightings of females in association with young; in parentheses the corresponding expected number of sightings under hypothesis H0 that the encounter rate (ER) is the same throughout the entire study area; column 3: total number of sightings of females alone or in association with young; in parentheses the corresponding expected number of sightings under the same H0 hypothesis; column 4: sighting effort in km; column 5: ER of adult females in steady association with a young individual per 1000 km of sighting effort; column 6: ER of adult females, per 1000 km of sighting effort.
Table II. Female fertility under the four different scenarios described in the text. Per each scenario: (a) the number of births (first row); (b) the exposure time (second row); (c) the resulting fertility rate b (third row) per 1000 adult females yr−1 (computed by dividing the number of births by the exposure time), in parentheses below, the corresponding 95% bootstrap percentile confidence interval (CI); (d) the corresponding predicted interval between births, computed as 1/b (fourth column).
Table III. Summary reproduction parameters of genus Tursiops in the literature. aThis study; bMitchenson (Citation2008); cFruet et al. (Citation2015); dWells and Scott (Citation1990); eTezanos-Pinto et al. (Citation2015); fHenderson et al. (Citation2014); gKogi et al. (Citation2004); hMann et al. (Citation2000); iSteiner and Bossley (Citation2008).