
Figures & data
Table I. Monthly variation of isopod abundance and values of Shannon–Wiener (H′) and evenness indexes (J′) from October 2009 to September 2010. Di%, dominance; F%, frequency; N, total abundance of isopods; Ni, total abundance of species.
Figure 1. Water characteristics at Menzel Jemil station during the sampling period.
Figure 2. Relationship between isopod density and plant biomass at Menzel Jemil.
Figure 3. Distribution of isopods at Menzel Jemil station during sampling period. (a) Temporal distribution; (b) Greatest abundance of I. b. basteri in winter and spring and at 80 cm.
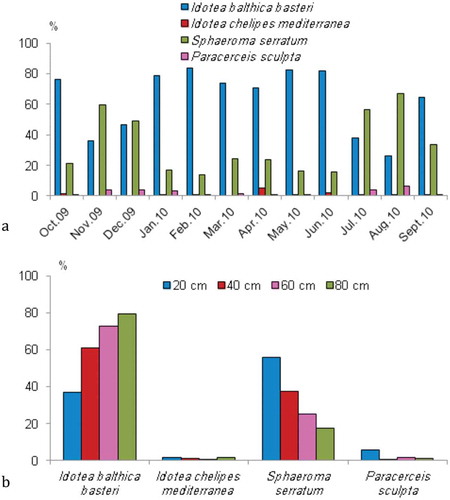
Figure 4. Temporal dynamics of the two dominant species in the algae and seagrass at Menzel Jemil. (a) Idotea balthica basteri, (b) Sphaeroma serratum. The shaded area represents species density, as total number of individuals per square metre; the darker area indicates juveniles.
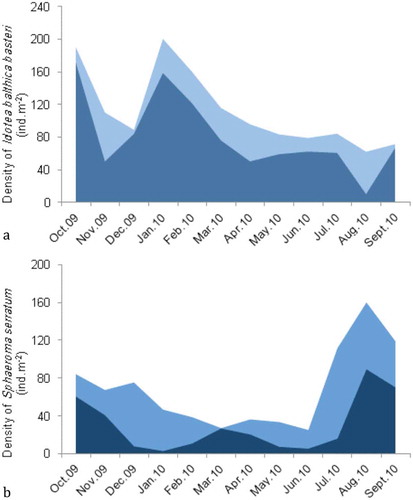
Figure 5. Abundance of the two dominant species of isopods according to different (a) temperatures and (b) salinity conditions.
Figure 6. Multidimensional scaling (MDS) based on quantitative (square root transformation data) similarity (Bray–Curtis measure) amongst the isopods during sampling period.
Table II. Multiple stepwise regression analysis of isopod abundance (N) in relation to environmental variables from October 2009 to September 2010. SE, standard error. Only environmental variables accepted in each regression model (p < 0.05) have been listed. G. long, Gracilariopsis longissima; G. b. pas, Gracilaria bursa-pastoris; U. lac, Ulva lactuca; t, t-statistic.
Table III. Results of biotic and environmental linking (BIOENV) analysis displaying the three highest Spearman rank correlations using square root quantitative data of isopods collected from October 2009 to September 2010. T, temperature (°C); U.lac, Ulva lactuca biomass (g.m−2); G.b.p, Gracilaria bursa-pastoris biomass (g.m−2).