Figures & data
Table I. Basic statistic estimates of developmental mode – flight style groups: n = number of species in the group; mean = mean value; SD = standard deviation; CF = continuous flapping; FG = flapping and gliding; PT = passerine type; FS = flapping and soaring flight styles; hu = humerus; ul = ulna; mn = manus; fprim = primary feather; ta = total arm length.
Table II. Association of evolutionary histories of flight style and developmental mode of birds: D = overall measure of evolutionary association; dij = measure of association for specific pairs of developmental mode and flight style; p = significance value of estimates; CF = continuous flapping; FG = flapping and gliding; FS = flapping and soaring; PT = passerine type flight styles.
Figure 1. Phylogenetic hypothesis of relationships amongst studied birds (Hackett et al. Citation2008) showing modes of development and flight styles: sp = number of the studied species; CF = continuous flapping; FG = flapping and gliding; FS = flapping and soaring; PT = passerine type flight styles.
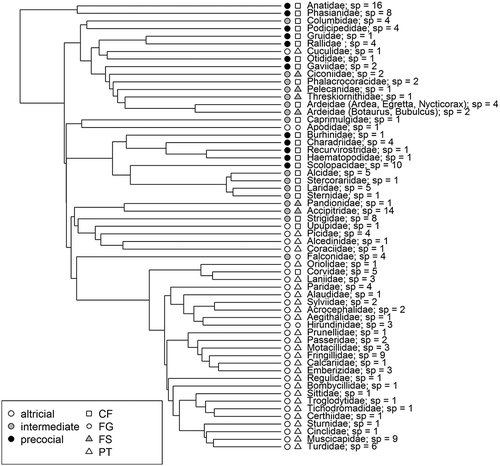
Table III. The effect of body mass estimated with the analysis of best-fit PGLS models with the AICc differences (Δ) and multiple R2: dev.mode = developmental mode, flight = flight style; hu = humerus; ul = ulna; mn = manus; fprim = primary feather length. All models were significant (pFDR < 0.03).
Figure 2. Phylogenetic discriminant analysis of developmental mode and flight style groups by wingspan (plots (a) and (c)) and wing elements (plots (b) and (d)) data sets. Convex hulls, which connect the most distant points of each group, are shown. Other group points were omitted from the plot. The length of arrows represents the contribution of the traits to discrimination. altr. = altricial; interm. = intermediate; prec. = precocial developmental modes; CF = continuous flapping; FG = flapping and gliding; FS = flapping and soaring; PT = passerine type flight styles; hu = humerus; ul = ulna; mn = manus; fprim = primary feather length.
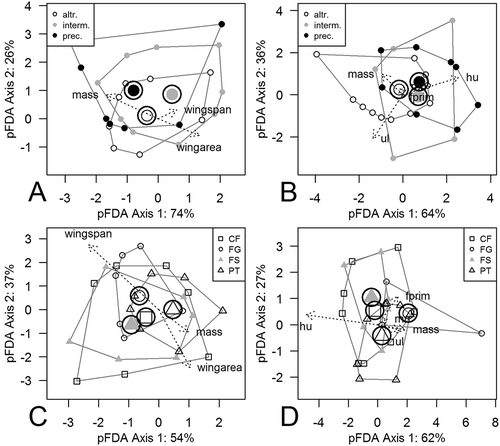
Figure 3. Standard discriminant analysis of developmental mode and flight style groups by wingspan (plots (a) and (c)) and wing elements (plots (b) and (d)) data sets. Convex hulls, which connect the most distant points of each group, are shown. Other group points were omitted from the plot. The length of arrows represents the contribution of the traits to discrimination. altr. = altricial; interm. = intermediate; prec. = precocial developmental modes; CF = continuous flapping; FG = flapping and gliding; FS = flapping and soaring; PT = passerine type flight styles; hu = humerus; ul = ulna; mn = manus; fprim = primary feather length.
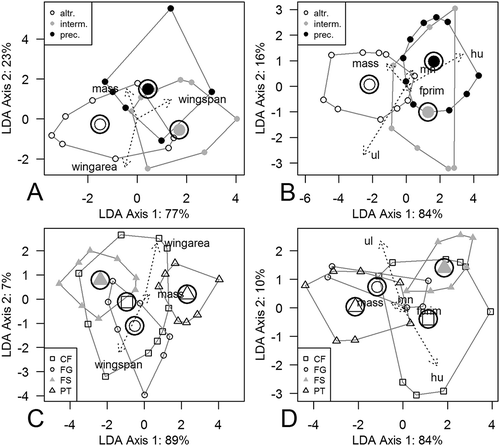
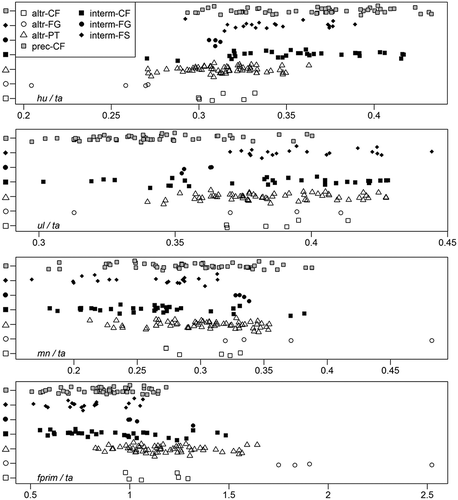
Figure 4. Cleveland’s dot chart of the relative length of wing elements. Each point represents a species. Developmental modes and flight styles are marked with different types of points. altr = altricial; interm = intermediate; prec= precocial developmental modes; CF = continuous flapping; FG = flapping and gliding; FS = flapping and soaring; PT = passerine type flight styles; hu = humerus; ul = ulna; mn = manus; fprim = primary feather; ta = total arm length.